Olympus 2010 Annual Report Download - page 62
Download and view the complete annual report
Please find page 62 of the 2010 Olympus annual report below. You can navigate through the pages in the report by either clicking on the pages listed below, or by using the keyword search tool below to find specific information within the annual report.-
 1
1 -
2
-
3
-
4
-
5
-
6
-
7
-
8
-
9
-
10
-
11
-
12
-
13
-
14
-
15
-
16
-
17
-
18
-
19
-
20
-
21
-
22
-
23
-
24
-
25
-
26
-
27
-
28
-
29
-
30
-
31
-
32
-
33
-
34
-
35
-
36
-
37
-
38
-
39
-
40
-
41
-
42
-
43
-
44
-
45
-
46
-
47
-
48
-
49
-
50
-
51
-
 52
52 -
 53
53 -
 54
54 -
 55
55 -
 56
56 -
 57
57 -
 58
58 -
 59
59 -
 60
60 -
 61
61 -
 62
62 -
 63
63 -
 64
64 -
 65
65 -
 66
66 -
 67
67 -
 68
68
 |
 |

60 OLYMPUS 2010
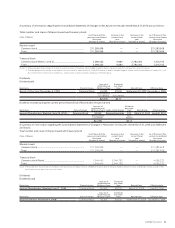
(b) Information by geographic location
Millions of yen
2010
Japan America Europe Asia Total
Elimination and
Corporate
Consolidated
Total
Net sales:
Unaffiliated customers ...... ¥408,837 ¥211,609 ¥198,661 ¥63,979 ¥883,086 ¥ — ¥ 883,086
Intersegment ..................... 217,285 7,982 15,000 65,262 305,529 (305,529) —
Total ...................................... 626,122 219,591 213,661 129,241 1,188,615 (305,529) 883,086
Operating expenses ............... 577,632 212,436 191,465 123,606 1,105,139 (282,202) 822,937
Operating income .................. 48,490 7,155 22,196 5,635 83,476 (23,327) 60,149
Assets ................................... ¥251,505 ¥299,184 ¥296,674 ¥122,356 ¥969,719 ¥182,508 ¥1,152,227
Millions of yen
2009
Japan America Europe Asia Total
Elimination and
Corporate
Consolidated
Total
Net sales:
Unaffiliated customers ...... ¥ 394,459 ¥ 256,894 ¥ 256,958 ¥ 72,492 ¥ 980,803 ¥ — ¥ 980,803
Intersegment ..................... 262,143 8,588 17,846 75,814 364,391 (364,391) —
Total ...................................... 656,602 265,482 274,804 148,306 1,345,194 (364,391) 980,803
Operating expenses ............... 627,516 260,810 257,092 141,785 1,287,203 (340,987) 946,216
Operating income .................. ¥ 29,086 ¥ 4,672 ¥ 17,712 ¥ 6,521 ¥ 57,991 ¥ (23,404) ¥ 34,587
Assets ................................... ¥ 271,176 ¥ 320,479 ¥ 254,435 ¥ 113,812 ¥ 959,902 ¥ 146,416 ¥ 1,106,318
Millions of yen
2008
Japan America Europe Asia Total
Elimination and
Corporate
Consolidated
Total
Net sales:
Unaffiliated customers ...... ¥ 484,146 ¥ 259,137 ¥ 299,667 ¥ 85,925 ¥ 1,128,875 ¥ — ¥ 1,128,875
Intersegment ..................... 341,219 10,675 13,318 110,410 475,622 (475,622) —
Total ...................................... 825,365 269,812 312,985 196,335 1,604,497 (475,622) 1,128,875
Operating expenses ............... 734,203 250,022 290,863 185,801 1,460,889 (444,637) 1,016,252
Operating income .................. ¥ 91,162 ¥ 19,790 ¥ 22,122 ¥ 10,534 ¥ 143,608 ¥ (30,985) ¥ 112,623
Assets ................................... ¥ 615,009 ¥ 364,099 ¥ 228,072 ¥ 121,033 ¥ 1,328,213 ¥ 30,136 ¥ 1,358,349
Thousands of U.S. dollars
2010
Japan America Europe Asia Total
Elimination and
Corporate
Consolidated
Total
Net sales:
Unaffiliated customers ...... $ 4,542,633 $ 2,351,211 $ 2,207,344 $ 710,879 $ 9,812,067 $ — $ 9,812,067
Intersegment ..................... 2,414,278 88,689 166,667 725,133 3,394,767 (3,394,767) —
Total ...................................... 6,956,911 2,439,900 2,374,011 1,436,012 13,206,834 (3,394,767) 9,812,067
Operating expenses ............... 6,418,133 2,360,400 2,127,389 1,373,401 12,279,323 (3,135,578) 9,143,745
Operating income .................. 538,778 79,500 246,622 62,611 927,511 (259,189) 668,322
Assets ................................... $ 2,794,500 $ 3,324,267 $ 3,296,378 $ 1,359,511 $ 10,774,656 $ 2,027,866 $ 12,802,522
Notes: Segmentation is determined by geographical adjacency.
America includes the United States, Canada, Mexico and Brazil. Europe includes Germany, the United Kingdom, France and other countries. Asia includes Singapore,
Hong Kong, China, South Korea, Australia and other countries.