Pier 1 2011 Annual Report Download - page 117
Download and view the complete annual report
Please find page 117 of the 2011 Pier 1 annual report below. You can navigate through the pages in the report by either clicking on the pages listed below, or by using the keyword search tool below to find specific information within the annual report.-
 1
1 -
2
-
3
-
4
-
5
-
6
-
7
-
8
-
9
-
10
-
11
-
12
-
13
-
14
-
15
-
16
-
17
-
18
-
19
-
20
-
21
-
22
-
23
-
24
-
25
-
26
-
27
-
28
-
29
-
30
-
31
-
32
-
33
-
34
-
35
-
36
-
37
-
38
-
39
-
40
-
41
-
42
-
43
-
44
-
45
-
46
-
47
-
48
-
49
-
50
-
51
-
52
-
53
-
54
-
55
-
56
-
57
-
58
-
59
-
60
-
61
-
62
-
63
-
64
-
65
-
66
-
67
-
68
-
69
-
70
-
71
-
72
-
73
-
74
-
75
-
76
-
77
-
78
-
79
-
80
-
81
-
82
-
83
-
84
-
85
-
86
-
87
-
88
-
89
-
90
-
91
-
92
-
93
-
94
-
95
-
96
-
97
-
98
-
99
-
100
-
101
-
102
-
103
-
104
-
105
-
106
-
 107
107 -
 108
108 -
 109
109 -
 110
110 -
 111
111 -
 112
112 -
 113
113 -
 114
114 -
 115
115 -
 116
116 -
 117
117 -
 118
118 -
 119
119 -
 120
120 -
 121
121 -
 122
122 -
 123
123 -
 124
124 -
 125
125 -
 126
126 -
 127
127 -
128
-
129
-
130
-
131
-
132
-
133
-
134
-
135
-
136
-
137
-
138
-
139
-
140
-
141
-
142
-
143
-
144
 |
 |

items. For discussion purposes we refer to this performance measure as the Profit Goal. The Profit Goal was
selected as the appropriate financial measure because it focuses on factors that an individual participant’s actions
can affect. Pier 1 Imports believes the Profit Goal is a better measure of core operating performance because it
eliminates the effects of financing and tax decisions as well as unusual charges and more closely reflects cash being
generated by Pier 1 Imports’ ongoing core operations. Also, designing the short-term incentive Profit Goal
specifically around Pier 1 Imports’ improved financial and operational performance reinforces Pier 1 Imports’
turnaround strategy thereby leading to increased profitability over time. Additional information and factors relating
to Pier 1 Imports’ fiscal 2011 annual short-term incentive program are included in Table 1 above.
These factors were discussed with the compensation committee and, as a result, the compensation committee
approved the plan and set quarterly and annual Profit Goal target levels for fiscal 2011. The Profit Goal targets and
the actual Pier 1 Imports’ results are shown in Table 2 below.
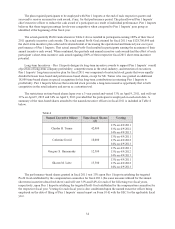
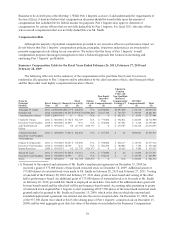
Table 2
Pier 1 Imports’ Fiscal 2011 Quarterly and Annual
Profit Goal Short-Term Incentive
Fiscal Year 2011 Target Actual Results
1st Quarter ($ 4,500,000) $ 14,200,000
2nd Quarter ($ 2,400,000) $ 21,600,000
3rd Quarter $15,700,000 $ 27,800,000
4th Quarter $51,200,000 $ 65,100,000
Annual Target $60,000,000 $128,700,000
The fiscal 2011 targeted annual Profit Goal of $60,000,000 represented an approximate 88% increase over the
actual results of the annual Profit Goal for fiscal 2010 of $31,900,000. The fiscal 2011 targeted annual Profit Goal
supported our shift in focus from returning to profitability, which was achieved in fiscal 2010, to increasing our
profitability in fiscal 2011.
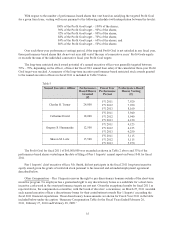
The Pier 1 Imports’ fiscal 2011 short-term incentive program had two primary components, the annual
component and the quarterly component. Each named executive officer’s fiscal 2011 short-term incentive potential
(which was expressed as a percentage of the officer’s base salary) was divided equally between the quarterly and
annual component. Additional information regarding the named executive officers’ fiscal 2011 incentive targets and
the quarterly and annual component details are shown in Table 3 below.
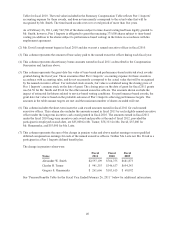
Table 3
Named
Executive
Officer
Fiscal 2011
Short-Term
Incentive
Potential
Quarterly Incentive Component Annual Incentive Component
=
Q1 Q2 Q3 Q4
+ Threshold
50%
Target
100%
Maximum
300%
CEO 100% 12.5% 12.5% 12.5% 12.5% 25% 50% 150%
CFO & EVP 75% 9.375% 9.375% 9.375% 9.375% 18.75% 37.5% 112.5%
The short-term incentive opportunity for
the named executive officers (expressed
as a percentage of base salary) was
comprised of 2 components, the quarterly
incentive component and the annual
incentive component.
The quarterly incentive component was
based on the achievement of each fiscal
quarter’s targeted Profit Goal. Each quarter
was measured independently on a pass or
fail basis and was paid out at either 100%
upon successful achievement of the targeted
quarterly Profit Goal, or 0% if the goal was
not met.
The annual incentive component
was based on the achievement of the
targeted annual Profit Goal, which is
the cumulative total for the quarterly
targeted Profit Goals for the fiscal
year. The threshold Profit Goal that
would result in a 50% payout of the
annual component of the short-term
incentive target was $40,000,000.
Achieving the target Profit Goal of
$60,000,000 would result in a 100%
payout. A maximum payout of
300% would occur if the annual
Profit Goal met or exceeded
$96,000,000.
33