Pier 1 2011 Annual Report Download - page 26
Download and view the complete annual report
Please find page 26 of the 2011 Pier 1 annual report below. You can navigate through the pages in the report by either clicking on the pages listed below, or by using the keyword search tool below to find specific information within the annual report.-
 1
1 -
2
-
3
-
4
-
5
-
6
-
7
-
8
-
9
-
10
-
11
-
12
-
13
-
14
-
15
-
 16
16 -
 17
17 -
 18
18 -
 19
19 -
 20
20 -
 21
21 -
 22
22 -
 23
23 -
 24
24 -
 25
25 -
 26
26 -
 27
27 -
 28
28 -
 29
29 -
 30
30 -
 31
31 -
 32
32 -
 33
33 -
 34
34 -
 35
35 -
 36
36 -
37
-
38
-
39
-
40
-
41
-
42
-
43
-
44
-
45
-
46
-
47
-
48
-
49
-
50
-
51
-
52
-
53
-
54
-
55
-
56
-
57
-
58
-
59
-
60
-
61
-
62
-
63
-
64
-
65
-
66
-
67
-
68
-
69
-
70
-
71
-
72
-
73
-
74
-
75
-
76
-
77
-
78
-
79
-
80
-
81
-
82
-
83
-
84
-
85
-
86
-
87
-
88
-
89
-
90
-
91
-
92
-
93
-
94
-
95
-
96
-
97
-
98
-
99
-
100
-
101
-
102
-
103
-
104
-
105
-
106
-
107
-
108
-
109
-
110
-
111
-
112
-
113
-
114
-
115
-
116
-
117
-
118
-
119
-
120
-
121
-
122
-
123
-
124
-
125
-
126
-
127
-
128
-
129
-
130
-
131
-
132
-
133
-
134
-
135
-
136
-
137
-
138
-
139
-
140
-
141
-
142
-
143
-
144
 |
 |

Company’s website was launched last October. Pier 1 To-Go, which will allow customers to order and reserve
merchandise online and be picked up and paid for at any of the Company’s stores, will be fully launched in the
spring of fiscal 2012. In fiscal 2013, the Company plans to enter full e-commerce functionality by allowing
customers to purchase merchandise online from its website.
The Company remains focused on increasing sales productivity and maximizing profitability of its
existing store portfolio. Over the next three years, the Company’s store improvement initiatives will impact
approximately 90% of the existing stores and include capital investments in new store fixtures, store remodels
and other leasehold improvements. The Company has developed new merchandise fixtures designed to give the
stores a more open look allowing merchandise to be visible and accessible on all sides of the unit, and enhancing
the in-store shopping experience for customers. Store remodel plans over the next three years range from minor
cosmetic improvements in most cases to major construction efforts such as new flooring and lighting, structural
enhancements and new fixtures. Other investments to improve the Company’s existing store portfolio will
include new lighting and sign upgrades to select stores, equipment upgrades, such as new HVAC units, and other
general leasehold improvements.
The Company’s growth plan also includes investing in the expansion of its existing store portfolio from
1,046 Pier 1 Imports stores today throughout the United States and Canada to approximately 1,100 Pier 1 Imports
stores in the United States and Canada within five years. The Company currently plans to open approximately 80
stores and close approximately 30 stores as part of its net new store growth initiative.
The Company’s three-year plan includes capital investments in infrastructure development and
technology to facilitate continued improvements in processes, efficiencies and analytics throughout the
organization. Investments in information technology will include a new point-of-sale system, an e-commerce
platform, replacement of legacy systems, new software for store labor schedule optimization and enhancements
to existing systems. In addition, the Company will invest in new store traffic counters, cash stand computer
kiosks and other network and infrastructure needs.
The following discussion and analysis of financial condition, results of operations, and liquidity and
capital resources relates to continuing operations, unless otherwise stated, and should be read in conjunction with
the accompanying audited Consolidated Financial Statements and notes thereto which can be found in Item 8 of
this report.
Overview of Business
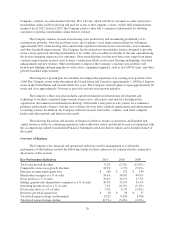
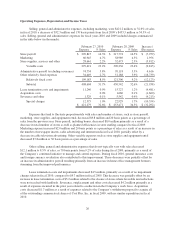
The Company’s key financial and operational indicators used by management to evaluate the
performance of the business include the following (trends for these indicators are explained in the comparative
discussions of this section):
Key Performance Indicators 2011 2010 2009
Total sales growth (decline) 8.2% (2.3%) (12.6%)
Comparable stores sales growth (decline) 10.9% 1.5% (9.2%)
Sales per average retail square foot $ 168 $ 152 $ 149
Merchandise margins as a % of sales 58.6% 54.8% 49.0%
Gross profit as a % of sales 39.8% 34.1% 27.5%
Selling, general and administrative expenses as a % of sales 30.9% 32.6% 34.3%
Operating income (loss) as a % of sales 7.4% (0.3%) (9.1%)
Net income (loss) as a % of sales 7.2% 6.7% (9.8%)
Inventory per retail square foot $ 38 $ 38 $ 37
Total retail square footage (in thousands) 8,232 8,290 8,586
Total retail square footage decline (0.7%) (3.4%) (2.2%)
20