Rite Aid 2015 Annual Report Download - page 83
Download and view the complete annual report
Please find page 83 of the 2015 Rite Aid annual report below. You can navigate through the pages in the report by either clicking on the pages listed below, or by using the keyword search tool below to find specific information within the annual report.-
 1
1 -
2
-
3
-
4
-
5
-
6
-
7
-
8
-
9
-
10
-
11
-
12
-
13
-
14
-
15
-
16
-
17
-
18
-
19
-
20
-
21
-
22
-
23
-
24
-
25
-
26
-
27
-
28
-
29
-
30
-
31
-
32
-
33
-
34
-
35
-
36
-
37
-
38
-
39
-
40
-
41
-
42
-
43
-
44
-
45
-
46
-
47
-
48
-
49
-
50
-
51
-
52
-
53
-
54
-
55
-
56
-
57
-
58
-
59
-
60
-
61
-
62
-
63
-
64
-
65
-
66
-
67
-
68
-
69
-
70
-
71
-
72
-
 73
73 -
 74
74 -
 75
75 -
 76
76 -
 77
77 -
 78
78 -
 79
79 -
 80
80 -
 81
81 -
 82
82 -
 83
83 -
 84
84 -
 85
85 -
 86
86 -
 87
87 -
 88
88 -
 89
89 -
 90
90 -
 91
91 -
 92
92 -
 93
93 -
94
-
95
-
96
-
97
-
98
-
99
-
100
-
101
-
102
-
103
-
104
-
105
-
106
-
107
-
108
-
109
-
110
-
111
-
112
-
113
-
114
-
115
-
116
-
117
-
118
-
119
-
120
-
121
-
122
-
123
-
124
-
125
-
126
-
127
-
128
-
129
-
130
-
131
 |
 |

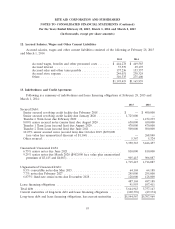
RITE AID CORPORATION AND SUBSIDIARIES
NOTES TO CONSOLIDATED FINANCIAL STATEMENTS (Continued)
For the Years Ended February 28, 2015, March 1, 2014 and March 2, 2013
(In thousands, except per share amounts)
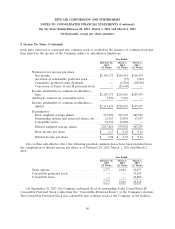
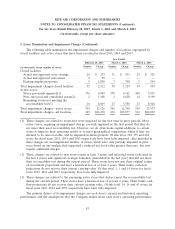
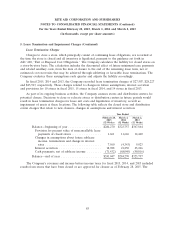
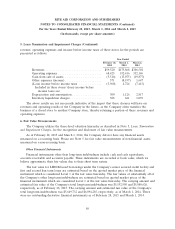
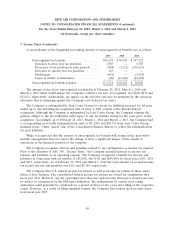
5. Lease Termination and Impairment Charges (Continued)
The following table summarizes the impairment charges and number of locations, segregated by
closed facilities and active stores that have been recorded in fiscal 2015, 2014 and 2013:
Year Ended
February 28, 2015 March 1, 2014 March 2, 2013
Number Charge Number Charge Number Charge
(in thousands, except number of stores)
Closed facilities:
Actual and approved store closings ...... 24 $ 372 31 $ 531 29 $ 325
Actual and approved relocations ........ 2 50 — — — —
Existing surplus properties ............ 9 1,890 7 798 5 594
Total impairment charges-closed facilities . . . 35 2,312 38 1,329 34 919
Active stores:
Stores previously impaired(1) .......... 376 6,949 378 4,162 469 5,835
New, relocated and remodeled stores(2) . . . 2 1,108 1 4,028 14 9,190
Remaining stores not meeting the
recoverability test(3) ............... 16 4,069 17 3,558 47 8,948
Total impairment charges—active stores .... 394 12,126 396 11,748 530 23,973
Total impairment charges—all locations ..... 429 $14,438 434 $13,077 564 $24,892
(1) These charges are related to stores that were impaired for the first time in prior periods. Most
active stores, requiring an impairment charge, are fully impaired in the first period that they do
not meet their asset recoverability test. However, we do often make capital additions to certain
stores to improve their operating results or to meet geographical competition, which if later are
deemed to be unrecoverable, will be impaired in future periods. Of this total, 369, 375 and 464
stores for fiscal years 2015, 2014 and 2013 respectively have been fully impaired. Also included in
these charges are an insignificant number of stores, which were only partially impaired in prior
years based on our analysis that supported a reduced net book value greater than zero, but now
require additional charges.
(2) These charges are related to new stores (open at least 3 years) and relocated stores (relocated in
the last 2 years) and significant strategic remodels (remodeled in the last year) that did not meet
their recoverability test during the current period. These stores have not met their original return
on investment projections and have a historical loss of at least 2 years. Their future cash flow
projections do not recover their current carrying value. Of this total, 1, 1 and 14 stores for fiscal
years 2015, 2014 and 2013 respectively have been fully impaired.
(3) These charges are related to the remaining active stores that did not meet the recoverability test
during the current period. These stores have a historical loss of at least 2 years. Their future cash
flow projections do not recover their current carrying value. Of this total, 14, 14 and 43 stores for
fiscal years 2015, 2014 and 2013 respectively have been fully impaired.
The primary drivers of its impairment charges are each store’s current and historical operating
performance and the assumptions that the Company makes about each store’s operating performance
83