Southwest Airlines 1995 Annual Report Download - page 22
Download and view the complete annual report
Please find page 22 of the 1995 Southwest Airlines annual report below. You can navigate through the pages in the report by either clicking on the pages listed below, or by using the keyword search tool below to find specific information within the annual report.-
 1
1 -
2
-
3
-
4
-
5
-
6
-
7
-
8
-
9
-
10
-
11
-
 12
12 -
 13
13 -
 14
14 -
 15
15 -
 16
16 -
 17
17 -
 18
18 -
 19
19 -
 20
20 -
 21
21 -
 22
22 -
 23
23 -
 24
24 -
 25
25 -
 26
26 -
 27
27 -
 28
28 -
 29
29 -
 30
30 -
 31
31 -
 32
32 -
33
-
34
-
35
-
36
-
37
-
38
-
39
-
40
-
41
-
42
-
43
-
44
-
45
-
46
 |
 |

22
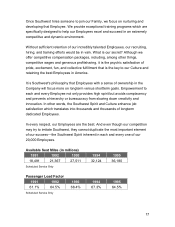
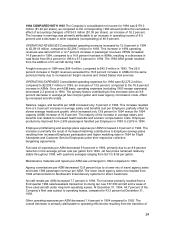
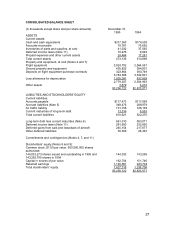
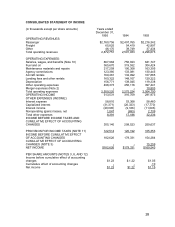
OPERATING REVENUES Consolidated operating revenues increased by 10.8 percent in 1995
to $2,872.8 million, compared to $2,591.9 million for 1994. This increase in 1995 operating
revenues was derived from a 10.5 percent increase in passenger revenues. Revenue passenger
miles (RPMs) increased 7.9 percent in 1995, compared to a 12.6 percent increase in ASMs,
resulting in a decrease in load factor from 67.3 percent in 1994 to 64.5 percent in 1995. The
1995 ASM growth resulted from the addition of 25 aircraft during the year.
Freight revenues in 1995 were $65.8 million, compared to $54.4 million in 1994. The 21.0
percent increase in freight revenues exceeded the 12.6 percent increase in ASMs for the same
period primarily due to increased air freight volumes and United States mail services primarily
resulting from the development of new markets added in 1994.
OPERATING EXPENSES Consolidated operating expenses for 1995 were $2,559.2 million,
compared to $2,275.2 million in 1994, an increase of 12.5 percent, compared to the 12.6 percent
increase in ASMs. For the second consecutive year, operating expenses on a per-ASM basis
decreased year-over-year, down .1 percent in 1995.
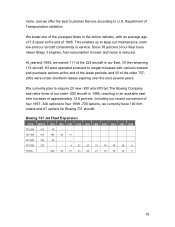
Operating expenses per ASM for 1995 and 1994 were as follows:
OPERATING EXPENSES PER ASM
Increase Percent
1995 1994 (decrease) Change
Salaries, wages, and
benefits 2.17¢ 2.13¢ .04¢ 1.9%
Employee profitsharing and
savings plans .23 .22 .01 4.5
Fuel and oil 1.01 1.00 .01 1.0
Maintenance materials and
repairs .60 .59 .01 1.7
Agency commissions .34 .41 (.07) (17.1)
Aircraft rentals .47 .42 .05 11.9
Landing fees and other
rentals .44 .46 (.02) (4.3)
Depreciation .43 .43 - -
Other 1.38 1.42 (.04) (2.8)
Total 7.07¢ 7.08¢ (.01)¢ (0.1)%
Salaries, wages, and benefits per ASM increased 1.9 percent in 1995. This increase resulted
primarily from a 17.8 percent increase in 1995 average headcount, which outpaced the 1995
capacity (ASM) increase of 12.6 percent, and offset a 2.6 percent decrease in average salary
and benefits cost per Employee. The 17.8 percent increase in average headcount was primarily
the result of a 44.6 percent increase in Reservations Sales Agents in 1995. Excluding
Reservations Sales Agents, total average headcount increased only 11.4 percent. The
Reservations Sales Agent increase coincided with increased demand for reservations capacity
following 1994 enhancements to Southwest’s ticket delivery systems for direct Customers.
Fleet Service Employees are subject to an agreement with the Ramp, Operations and
Provisioning Association (ROPA), which became amendable in December 1994. The Company
reached an agreement with ROPA which was ratified by its membership in November 1995.
Southwest’s mechanics are subject to an agreement with the International Brotherhood of
Teamsters, Chauffeurs, Warehousemen and Helpers of America (the Teamsters), which became