Supercuts 2002 Annual Report Download - page 30
Download and view the complete annual report
Please find page 30 of the 2002 Supercuts annual report below. You can navigate through the pages in the report by either clicking on the pages listed below, or by using the keyword search tool below to find specific information within the annual report.-
 1
1 -
2
-
3
-
4
-
5
-
6
-
7
-
8
-
9
-
10
-
11
-
12
-
13
-
14
-
15
-
16
-
17
-
18
-
19
-
 20
20 -
 21
21 -
 22
22 -
 23
23 -
 24
24 -
 25
25 -
 26
26 -
 27
27 -
 28
28 -
 29
29 -
 30
30 -
 31
31 -
 32
32 -
 33
33 -
 34
34 -
 35
35 -
 36
36 -
 37
37 -
 38
38 -
 39
39 -
 40
40 -
41
-
42
-
43
-
44
-
45
-
46
-
47
-
48
-
49
-
50
-
51
-
52
-
53
-
54
-
55
-
56
-
57
-
58
-
59
-
60
-
61
-
62
-
63
-
64
-
65
-
66
-
67
-
68
-
69
-
70
-
71
-
72
-
73
-
74
-
75
-
76
-
77
-
78
-
79
-
80
-
81
-
82
-
83
-
84
-
85
-
86
-
87
-
88
-
89
-
90
-
91
-
92
-
93
-
94
-
95
-
96
-
97
-
98
-
99
-
100
-
101
-
102
-
103
-
104
-
105
-
106
-
107
-
108
-
109
-
110
-
111
-
112
-
113
-
114
-
115
-
116
-
117
-
118
-
119
-
120
-
121
-
122
-
123
-
124
-
125
-
126
-
127
-
128
-
129
-
130
-
131
-
132
-
133
-
134
-
135
-
136
-
137
-
138
-
139
-
140
-
141
-
142
-
143
-
144
-
145
-
146
-
147
-
148
-
149
-
150
-
151
-
152
-
153
-
154
-
155
-
156
-
157
-
158
-
159
-
160
-
161
-
162
-
163
-
164
-
165
-
166
-
167
-
168
-
169
-
170
-
171
-
172
-
173
-
174
-
175
-
176
-
177
 |
 |
Table of Contents
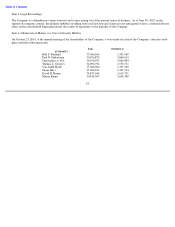
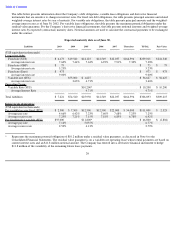
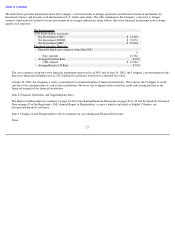
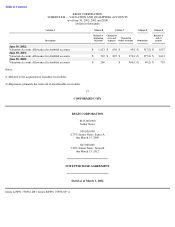
The table below provides information about the Company’s net investments in foreign operations and derivative financial instruments by
functional currency and presents such information in U.S. dollar equivalents. The table summarizes the Company’s exposure to foreign
currency translation risk related to its net investments in its foreign subsidiaries along with its derivative financial instruments used to hedge
against such exposure.
27
Net Investments:
(US$ Equivalent in thousands)
Net Investment (CND)
$
51,429
Net Investment (EURO)
$
72,053
Net Investment (GBP)
$
29,266
Foreign Currency Derivate:
Fixed
-
for
-
fixed cross currency swap (Euro/US)
Euro Amount
€
23,782
Average Pay Euro Rate
8.29
%
USD Amount
$
21,284
Average Receive US Rate
8.39
%
The cross currency swap derivative financial instrument expires in fiscal 2007 and at June 30, 2002, the Company’
s net investment in this
derivative financial instrument was in a $2.4 million loss position, based on its estimated fair value.
At June 30, 2002, the Company’s cash is concentrated at a limited number of financial institutions. This exposes the Company to credit
risk due to the concentrations of cash at these institutions. However, the Company believes that the credit risk is mitigated due to the
financial strength of the financial institutions.
Item 8. Financial Statements and Supplementary Data
The Report of Independent Accountants on page 44, the Consolidated Financial Statements on pages 26 to 42 and the Quarterly Financial
Data on page 43 of the Registrant’s 2002 Annual Report to Shareholders, a copy of which is included as Exhibit 13 hereto, are
incorporated herein by reference.
Item 9. Changes in and Disagreements with Accountants on Accounting and Financial Disclosure
None.