TomTom 2007 Annual Report Download - page 68
Download and view the complete annual report
Please find page 68 of the 2007 TomTom annual report below. You can navigate through the pages in the report by either clicking on the pages listed below, or by using the keyword search tool below to find specific information within the annual report.-
 1
1 -
2
-
3
-
4
-
5
-
6
-
7
-
8
-
9
-
10
-
11
-
12
-
13
-
14
-
15
-
16
-
17
-
18
-
19
-
20
-
21
-
22
-
23
-
24
-
25
-
26
-
27
-
28
-
29
-
30
-
31
-
32
-
33
-
34
-
35
-
36
-
37
-
38
-
39
-
40
-
41
-
42
-
43
-
44
-
45
-
46
-
47
-
48
-
49
-
50
-
51
-
52
-
53
-
54
-
55
-
56
-
57
-
 58
58 -
 59
59 -
 60
60 -
 61
61 -
 62
62 -
 63
63 -
 64
64 -
 65
65 -
 66
66 -
 67
67 -
 68
68 -
 69
69 -
 70
70 -
 71
71 -
 72
72 -
 73
73 -
 74
74 -
 75
75 -
 76
76 -
 77
77 -
 78
78 -
79
-
80
-
81
-
82
-
83
-
84
-
85
-
86
-
87
-
88
 |
 |

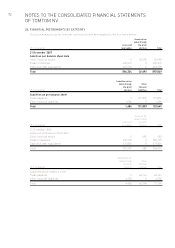
62 NOTES TO THE CONSOLIDATED FINANCIAL STATEMENTS
OF TOMTOM NV
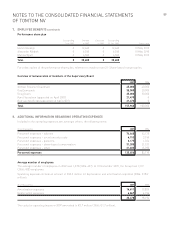
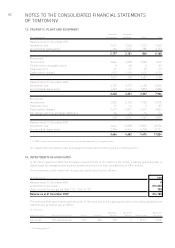
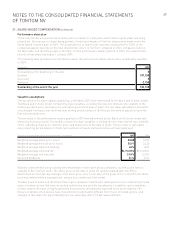
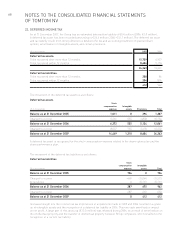
13. PROPERTY, PLANT AND EQUIPMENT
Furniture Computer
(€in thousands) and fixtures hardware1Other Total
Balance as at 31 December 2005
Investment cost 2,671 3,666 1,223 7,560
Accumulated depreciation -494 -1,515 -383 -2,392
2,177 2,151 840 5,168
Movements
Investments 2,062 2,258 2,950 7,270
Transferred to intangible assets 0 -45 0 -45
Disposals (net) -21 -19 -33 -73
Depreciation charges -970 -1,994 -1,430 -4,394
1,071 200 1,487 2,758
Balance as at 31 December 2006
Investment cost 4,705 5,973 4,128 14,806
Accumulated depreciation -1,457 -3,622 -1,801 -6,880
3,248 2,351 2,327 7,926
Movements
Investments 2,030 5,140 9,736 16,906
Disposals (net) -71 -16 0 -87
Depreciation charges -1,477 -2,817 -2,573 -6,867
Net foreign currency exchange difference -64 24 -14 -54
418 2,331 7,149 9,898
Balance as at 31 December 2007
Investment cost 6,614 10,098 13,824 30,536
Accumulated depreciation -2,948 -5,416 -4,348 -12,712
3,666 4,682 9,476 17,824
1In 2006 software was transferred from property, plant and equipment to intangible assets.
No impairment of property, plant and equipment was identified during the accounting period.
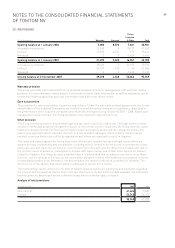
14. INVESTMENTS IN ASSOCIATES
In the fourth quarter of 2007, the Company acquired 29.9% of the shares of Tele Atlas, a leading global provider of
digital maps for navigation and location-based solutions, for a total consideration of €816 million.
The movements in the investment in associate can be specified as follows:
(€in thousands) 2007
Balanceas at 31 December 2006 0
Acquisition of associate816,030
Shareof profit for the period (Nov 7 ’07 – Dec 31 ’07) 758
Balanceas at 31 December 2007 816,788
The estimated full year revenue and net profit of the associate and its aggregated assets (excluding goodwill) and
liabilities areas follows (all at 100%):
(€in millions)
Revenues Net profit Published
Name associate Place of incorporation Assets1Liabilities full year full year Interest held fair value
TeleAtlas The Netherlands 1,143 284 318 2 29.9% 2,598
1 Excluding goodwill.