TomTom 2011 Annual Report Download - page 73
Download and view the complete annual report
Please find page 73 of the 2011 TomTom annual report below. You can navigate through the pages in the report by either clicking on the pages listed below, or by using the keyword search tool below to find specific information within the annual report.-
 1
1 -
2
-
3
-
4
-
5
-
6
-
7
-
8
-
9
-
10
-
11
-
12
-
13
-
14
-
15
-
16
-
17
-
18
-
19
-
20
-
21
-
22
-
23
-
24
-
25
-
26
-
27
-
28
-
29
-
30
-
31
-
32
-
33
-
34
-
35
-
36
-
37
-
38
-
39
-
40
-
41
-
42
-
43
-
44
-
45
-
46
-
47
-
48
-
49
-
50
-
51
-
52
-
53
-
54
-
55
-
56
-
57
-
58
-
59
-
60
-
61
-
62
-
 63
63 -
 64
64 -
 65
65 -
 66
66 -
 67
67 -
 68
68 -
 69
69 -
 70
70 -
 71
71 -
 72
72 -
 73
73 -
 74
74 -
 75
75 -
 76
76 -
 77
77 -
 78
78 -
 79
79 -
 80
80 -
 81
81 -
 82
82 -
 83
83 -
84
-
85
-
86
-
87
-
88
 |
 |

71
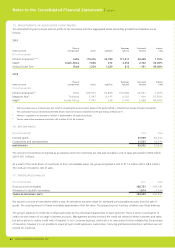
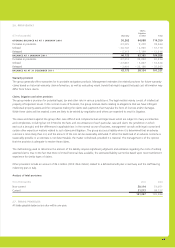
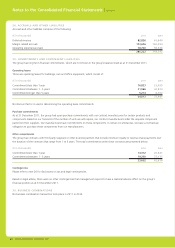
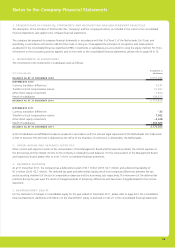
31. RELATED PARTY TRANSACTIONS
Refer to note 7 for transactions with key management personnel. Certain key management personnel also hold ownership interests in
TomTom NV as disclosed under the Corporate Governance section in page 27.
In the normal course of business, the group receives map development and support services from its associate Infotech Enterprises Ltd.
Such transactions take place at normal market conditions and the total payments made for these services in 2011 amounted to
€12.9 million (2010: €13.6 million)
32. AUDITORS’ REMUNERATION
The total remuneration to Deloitte for the statutory audit of 2011 for the group amounted to €436,000 (2010: €473,000). The total
service fees paid to the Deloitte network amounted to €1,429,000 (2010: €1,567,000). Included in the total remuneration is an amount of
€712,000 (2010: €717,000) invoiced by Deloitte Accountants B.V. Details of the audit, audit related and non audit fees paid to Deloitte can
also be found in the Supervisory Board report.
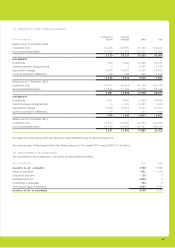
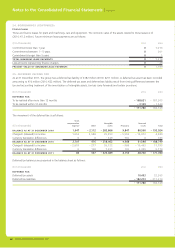
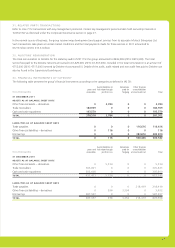
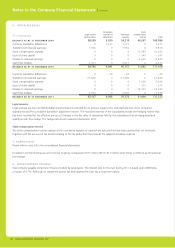
33. FINANCIAL INSTRUMENTS BY CATEGORY
The following table presents the group’s fi nancial instruments according to the categories as defi ned in IAS 39:
(€ in thousands)
Loans and
receivables
Assets/liabilities at
fair value through
profi t or loss
Derivatives
used for
hedging
Other fi nancial
assets/liabilities
at amortised cost Total
31 DECEMBER 2011
ASSETS AS AT BALANCE SHEET DATE
Other fi nancial assets – derivatives 0 2,784 0 0 2,784
Trade receivables 184,939000184,939
Cash and cash equivalents 193,579 0 0 0 193,579
TOTAL 378,518 2,784 0 0 381,302
LIABILITIES AS AT BALANCE SHEET DATE
Trade payables 0 0 0 116,616 116,616
Other fi nancial liabilities – derivatives 0 116 0 0 116
Borrowings 0 0 0 383,810 383,810
TOTAL 0 116 0 500,426 500,542
(€ in thousands)
Loans and
receivables
Assets/liabilities at
fair value through
profi t or loss
Derivatives
used for
hedging
Other fi nancial
assets/liabilities
at amortised cost Total
31 DECEMBER 2010
ASSETS AS AT BALANCE SHEET DATE
Other fi nancial assets – derivatives 0 5,724 0 0 5,724
Trade receivables 305,821 0 0 0 305,821
Cash and cash equivalents 305,600 0 0 0 305,600
TOTAL 611,421 5,724 0 0 617,145
LIABILITIES AS AT BALANCE SHEET DATE
Trade payables 0 0 0 218,419 218,419
Other fi nancial liabilities – derivatives 0 598 3,354 0 3,952
Borrowings 587,597 0 0 0 587,597
TOTAL 587,597 598 3,354 218,419 809,968