US Bank 2009 Annual Report Download - page 127
Download and view the complete annual report
Please find page 127 of the 2009 US Bank annual report below. You can navigate through the pages in the report by either clicking on the pages listed below, or by using the keyword search tool below to find specific information within the annual report.-
 1
1 -
2
-
3
-
4
-
5
-
6
-
7
-
8
-
9
-
10
-
11
-
12
-
13
-
14
-
15
-
16
-
17
-
18
-
19
-
20
-
21
-
22
-
23
-
24
-
25
-
26
-
27
-
28
-
29
-
30
-
31
-
32
-
33
-
34
-
35
-
36
-
37
-
38
-
39
-
40
-
41
-
42
-
43
-
44
-
45
-
46
-
47
-
48
-
49
-
50
-
51
-
52
-
53
-
54
-
55
-
56
-
57
-
58
-
59
-
60
-
61
-
62
-
63
-
64
-
65
-
66
-
67
-
68
-
69
-
70
-
71
-
72
-
73
-
74
-
75
-
76
-
77
-
78
-
79
-
80
-
81
-
82
-
83
-
84
-
85
-
86
-
87
-
88
-
89
-
90
-
91
-
92
-
93
-
94
-
95
-
96
-
97
-
98
-
99
-
100
-
101
-
102
-
103
-
104
-
105
-
106
-
107
-
108
-
109
-
110
-
111
-
112
-
113
-
114
-
115
-
116
-
 117
117 -
 118
118 -
 119
119 -
 120
120 -
 121
121 -
 122
122 -
 123
123 -
 124
124 -
 125
125 -
 126
126 -
 127
127 -
 128
128 -
 129
129 -
 130
130 -
 131
131 -
 132
132 -
 133
133 -
 134
134 -
 135
135 -
 136
136 -
 137
137 -
138
-
139
-
140
-
141
-
142
-
143
 |
 |

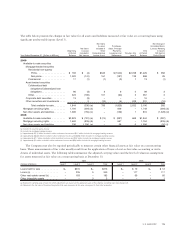
(Dollars in Millions, Except Per Share Data)
First
Quarter
Second
Quarter
Third
Quarter
Fourth
Quarter
First
Quarter
Second
Quarter
Third
Quarter
Fourth
Quarter
2009 2008
Interest Income
Loans . . . . . . . . . . . . . . . . . . . . . . . . . . . . . . . . . . . $2,350 $2,345 $2,373 $2,496 $2,560 $2,429 $2,487 $2,575
Loans held for sale . . . . . . . . . . . . . . . . . . . . . . . . . . 63 71 87 56 73 49 52 53
Investment securities . . . . . . . . . . . . . . . . . . . . . . . . . 434 402 374 396 535 494 478 477
Other interest income . . . . . . . . . . . . . . . . . . . . . . . . . 20 22 23 26 37 43 40 36
Total interest income . . . . . . . . . . . . . . . . . . . . . . 2,867 2,840 2,857 2,974 3,205 3,015 3,057 3,141
Interest Expense
Deposits. . . . . . . . . . . . . . . . . . . . . . . . . . . . . . . . . . 324 314 299 265 606 458 425 392
Short-term borrowings . . . . . . . . . . . . . . . . . . . . . . . . 143 131 138 127 322 263 276 205
Long-term debt . . . . . . . . . . . . . . . . . . . . . . . . . . . . . 353 341 313 272 474 419 423 423
Total interest expense . . . . . . . . . . . . . . . . . . . . . 820 786 750 664 1,402 1,140 1,124 1,020
Net interest income . . . . . . . . . . . . . . . . . . . . . . . . . . 2,047 2,054 2,107 2,310 1,803 1,875 1,933 2,121
Provision for credit losses . . . . . . . . . . . . . . . . . . . . . . 1,318 1,395 1,456 1,388 485 596 748 1,267
Net interest income after provision for credit losses . . . . . 729 659 651 922 1,318 1,279 1,185 854
Noninterest Income
Credit and debit card revenue . . . . . . . . . . . . . . . . . . . 256 259 267 273 248 266 269 256
Corporate payment products revenue . . . . . . . . . . . . . . 154 168 181 166 164 174 179 154
Merchant processing services . . . . . . . . . . . . . . . . . . . 258 278 300 312 271 309 300 271
ATM processing services. . . . . . . . . . . . . . . . . . . . . . . 102 104 103 101 84 93 94 95
Trust and investment management fees . . . . . . . . . . . . . 294 304 293 277 335 350 329 300
Deposit service charges . . . . . . . . . . . . . . . . . . . . . . . 226 250 256 238 257 278 286 260
Treasury management fees . . . . . . . . . . . . . . . . . . . . . 137 142 141 132 124 137 128 128
Commercial products revenue . . . . . . . . . . . . . . . . . . . 129 144 157 185 112 117 132 131
Mortgage banking revenue . . . . . . . . . . . . . . . . . . . . . 233 308 276 218 105 81 61 23
Investment products fees and commissions . . . . . . . . . . 28 27 27 27 36 37 37 37
Securities gains (losses), net . . . . . . . . . . . . . . . . . . . . (198) (19) (76) (158) (251) (63) (411) (253)
Other . . . . . . . . . . . . . . . . . . . . . . . . . . . . . . . . . . . . 169 90 168 245 559 113 8 61
Total noninterest income . . . . . . . . . . . . . . . . . . . 1,788 2,055 2,093 2,016 2,044 1,892 1,412 1,463
Noninterest Expense
Compensation . . . . . . . . . . . . . . . . . . . . . . . . . . . . . . 786 764 769 816 745 761 763 770
Employee benefits . . . . . . . . . . . . . . . . . . . . . . . . . . . 155 140 134 145 137 129 125 124
Net occupancy and equipment . . . . . . . . . . . . . . . . . . . 211 208 203 214 190 190 199 202
Professional services . . . . . . . . . . . . . . . . . . . . . . . . . 52 59 63 81 47 59 61 73
Marketing and business development . . . . . . . . . . . . . . 56 80 137 105 79 66 75 90
Technology and communications . . . . . . . . . . . . . . . . . 155 157 175 186 140 149 153 156
Postage, printing and supplies . . . . . . . . . . . . . . . . . . . 74 72 72 70 71 73 73 77
Other intangibles . . . . . . . . . . . . . . . . . . . . . . . . . . . . 91 95 94 107 87 87 88 93
Other . . . . . . . . . . . . . . . . . . . . . . . . . . . . . . . . . . . . 291 554 406 504 283 304 276 353
Total noninterest expense . . . . . . . . . . . . . . . . . . . 1,871 2,129 2,053 2,228 1,779 1,818 1,813 1,938
Income before income taxes . . . . . . . . . . . . . . . . . . . . 646 585 691 710 1,583 1,353 784 379
Applicable income taxes . . . . . . . . . . . . . . . . . . . . . . . 101 100 86 108 476 386 198 27
Net income . . . . . . . . . . . . . . . . . . . . . . . . . . . . . . . . 545 485 605 602 1,107 967 586 352
Net income attributable to noncontrolling interests . . . . . . (16) (14) (2) – (17) (17) (10) (22)
Net income attributable to U.S. Bancorp . . . . . . . . . . . . $ 529 $ 471 $ 603 $ 602 $1,090 $ 950 $ 576 $ 330
Net income applicable to U.S. Bancorp common
shareholders . . . . . . . . . . . . . . . . . . . . . . . . . . . . . $ 419 $ 221 $ 583 $ 580 $1,077 $ 926 $ 557 $ 259
Earnings per common share . . . . . . . . . . . . . . . . . . . . $ .24 $ .12 $ .31 $ .30 $ .62 $ .53 $ .32 $ .15
Diluted earnings per common share . . . . . . . . . . . . . . . $ .24 $ .12 $ .30 $ .30 $ .62 $ .53 $ .32 $ .15
U.S. BANCORP 125
U.S. Bancorp
Quarterly Consolidated Financial Data (Unaudited)