American Airlines 2000 Annual Report Download - page 2
Download and view the complete annual report
Please find page 2 of the 2000 American Airlines annual report below. You can navigate through the pages in the report by either clicking on the pages listed below, or by using the keyword search tool below to find specific information within the annual report.-
 1
1 -
 2
2 -
 3
3 -
 4
4 -
 5
5 -
 6
6 -
 7
7 -
 8
8 -
 9
9 -
 10
10 -
 11
11 -
 12
12 -
 13
13 -
14
-
15
-
16
-
17
-
18
-
19
-
20
-
21
-
22
-
23
-
24
-
25
-
26
-
27
-
28
-
29
-
30
-
31
-
32
-
33
-
34
-
35
-
36
-
37
-
38
-
39
-
40
-
41
-
42
-
43
-
44
 |
 |

Letter to Shareholders, Customers
and Employees 1
Operating Aircraft Fleets 5
Management’s Discussion and Analysis 6
Consolidated Financial Statements 14
Notes to Consolidated Financial Statements 19
Eleven Year Comparative Summary 36
This year’s AMR annual report looks a bit different, and for
good reason. For the first time, we are delivering our annual report
message through three different media – print, CD-ROM and the Web.
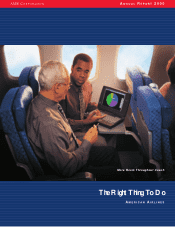
The theme of this year’s annual report, “The Right Thing To Do,”
applies very well to our More Room Throughout Coach initiative
pictured on the front and back covers. We felt it also applied to the
many things we did in 2000 and are continuing to do for our share-
holders, customers and employees. And we considered it equally
applicable to our use of different media to distribute this report. You
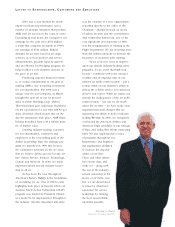
can read more about our efforts during 2000 in the Chairman’s Letter
on the opposite page. You can get a multi-media view of them on the
CD-ROM that accompanies the annual report. And on our Web site,
http://www.amrcorp.com/ar2000/index.html, you’ll find the informa-
tion that we traditionally have included in the shareholder, customer
and employee essays of our printed annual report.
TABLE OF CONTENTS ABOUT OUR AN N U AL REPORT
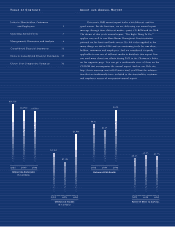
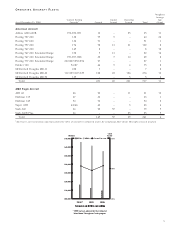
OPERATI NG REV ENU ES
($ in millions)
2000 1999 1998
$17,516
$17,730
$19,703
OPERATI NG INCOME
($ in millions)
$1,988
$1,156
$1,381
2000 1999 1998
EARN I NGS PER SHARE
$6.38
$4.17
$4.81
2000 1999 1998
RATIO OF DEBT TO CAPI TAL
64.7%
65.3%
62.4%
2000 1999 1998