American Airlines 2000 Annual Report Download - page 8
Download and view the complete annual report
Please find page 8 of the 2000 American Airlines annual report below. You can navigate through the pages in the report by either clicking on the pages listed below, or by using the keyword search tool below to find specific information within the annual report.-
 1
1 -
 2
2 -
 3
3 -
 4
4 -
 5
5 -
 6
6 -
 7
7 -
 8
8 -
 9
9 -
 10
10 -
 11
11 -
 12
12 -
 13
13 -
 14
14 -
 15
15 -
 16
16 -
 17
17 -
 18
18 -
 19
19 -
20
-
21
-
22
-
23
-
24
-
25
-
26
-
27
-
28
-
29
-
30
-
31
-
32
-
33
-
34
-
35
-
36
-
37
-
38
-
39
-
40
-
41
-
42
-
43
-
44
 |
 |

6
MANAGEMENT ’SDI SCUSSION AN D AN ALYSIS
AMR Corporation (AMR or the Company) was incor-
porated in October 1982. AMR’s principal subsidiary,
American Airlines, Inc. (American), was founded in
1934. AMR’s operations fall almost entirely in the
airline industry.
RESU LTS OF OPERATION S
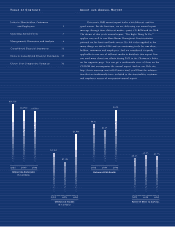
AMR’s net earnings in 2000 were $813 million, or
$5.43 per common share ($5.03 diluted). AMR’s income
from continuing operations before extraordinary loss
in 2000 was $779 million, or $5.20 per common share
($4.81 diluted). The results for 2000 include the follow-
ing special items: (i) a gain of $57 million ($36 million
after tax) from the sale of the Company’s warrants to
purchase 5.5 million shares of priceline.com Incorpo-
rated (priceline) common stock, (ii) a gain of approx-
imately $41 million ($26 million after tax) from the
recovery of start-up expenses from the Canadian
Airlines International Limited (Canadian) services
agreement, and (iii) a charge of $56 million ($35 mil-
lion after tax) for the Company’s employee home
computer program.
AMR’s net earnings in 1999 were $985 mil-
lion, or $6.46 per common share ($6.26 diluted).
AMR’s income from continuing operations in 1999
was $656 million, or $4.30 per common share
($4.17 diluted). A labor disagreement that disrupted
operations during the first quarter of 1999 negatively
impacted the Company’s 1999 results by an estimated
$225 million ($140 million after tax). The results for
1999 also include the following: (i) American’s Decem-
ber 1998 acquisition of Reno Air, Inc. (Reno) and AMR
Eagle’s March 1999 acquisition of Business Express, Inc.
(Business Express), (ii) a gain of $83 million ($64 mil-
lion after tax) on the sale of AMR Services, AMR Combs
and TeleService Resources, which is included in dis-
continued operations, (iii) a gain of approximately
$213 million ($118 million after taxes and minority
interest) resulting from the sale of a portion of the
Company’s holding in Equant N.V. (Equant), of which
approximately $75 million ($47 million after tax) is
included in income from continuing operations, (iv) a
gain of $40 million ($25 million after tax) from the
Company’s sale of its investment in the cumulative
mandatorily redeemable convertible preferred stock
of Canadian and a $67 million tax benefit resulting from
the tax loss on the Company’s investment in Canadian,
and (v) a charge of approximately $37 million ($25 mil-
lion after tax) relating to the provision for certain litiga-
tion items.
REVENU ES
2000 Compared to 1999 The Company’s revenues
increased approximately $2.0 billion, or 11.1 percent,
versus 1999. American’s passenger revenues increased
by 11.4 percent, or $1.7 billion. American’s yield (the
average amount one passenger pays to fly one mile)
of 14.05 cents increased by 7.1 percent compared to
1999. For the year, domestic yields increased 7.5 per-
cent while European, Latin American and Pacific yields
increased 9.9 percent, 4.2 percent and 3.8 percent,
respectively. The increase in revenues was due pri-
marily to a strong U.S. economy, which led to strong
demand for air travel both domestically and internation-
ally, a favorable pricing climate, the impact of a domes-
tic fuel surcharge implemented in January 2000 and
increased in September 2000, a labor disruption at
one of the Company’s competitors which positively
impacted the Company’s revenues by approximately
$80 to $100 million, and a schedule disruption which
negatively impacted the Company’s operations in 1999.
American’s domestic traffic increased 2.7 percent
to 78.5 billion revenue passenger miles (RPMs), while
domestic capacity, as measured by available seat miles
(ASMs), decreased 1.6 percent. The decrease in domes-
tic capacity was due primarily to the Company’s More
Room Throughout Coach program. (The Company’s
More Room Throughout Coach program reconfigures
American’s entire fleet to increase the seat pitch from
the present industry standard of 31 and 32 inches to
apredominant seat pitch of 34 and 35 inches.) Inter-
national traffic grew 6.8 percent to 38.1 billion RPMs
on capacity growth of 3.1 percent. The increase in
international traffic was led by a 12.2 percent increase
in the Pacific on capacity growth of 2.5 percent, an
8.5 percent increase in Europe on capacity growth of
6.7 percent, and a 4.1 percent increase in Latin America
on capacity growth of 0.4 percent. In 2000, American
derived approximately 70 percent of its passenger
revenues from domestic operations and approximately
30 percent from international operations.