American Airlines 2000 Annual Report Download - page 7
Download and view the complete annual report
Please find page 7 of the 2000 American Airlines annual report below. You can navigate through the pages in the report by either clicking on the pages listed below, or by using the keyword search tool below to find specific information within the annual report.-
 1
1 -
 2
2 -
 3
3 -
 4
4 -
 5
5 -
 6
6 -
 7
7 -
 8
8 -
 9
9 -
 10
10 -
 11
11 -
 12
12 -
 13
13 -
 14
14 -
 15
15 -
 16
16 -
 17
17 -
 18
18 -
19
-
20
-
21
-
22
-
23
-
24
-
25
-
26
-
27
-
28
-
29
-
30
-
31
-
32
-
33
-
34
-
35
-
36
-
37
-
38
-
39
-
40
-
41
-
42
-
43
-
44
 |
 |

5
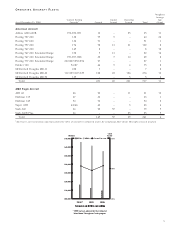
OPERATIN G AIRCRAFT FLEETS
Weighted
Average
Current Seating Capital Operating Age
As of December 31, 2000 Capacity1Owned Leased Leased Total (Years)
Ame ric an Aircra ft
Airbus A300-600R 192/250/251 10 – 25 35 11
Boeing 727-200 138 55 5 – 60 24
Boeing 737-800 134 51 – – 51 1
Boeing 757-200 176 58 13 31 102 8
Boeing 767-200 165 8 – – 8 18
Boeing 767-200 Extended Range 158 9 13 – 22 14
Boeing 767-300 Extended Range 190/207/228 32 7 10 49 8
Boeing 777-200 Extended Range 230/237/252/254 27 – – 27 1
Fokker 100 56/87 66 5 4 75 8
McDonnell Douglas MD-11 238 7 – – 7 8
McDonnell Douglas MD-80 112/125/127/129 128 22 126 276 13
McDonnell Douglas MD-90 135 – – 5 5 4
Total 451 65 201 717 11
AMR Eagle Aircra ft
ATR 42 46 20 – 11 31 10
Embraer 135 37 33 – – 33 1
Embraer 145 50 50 – – 50 2
Super ATR 64/66 40 – 3 43 6
Saab 340 34 22 57 – 79 9
Saab 340B Plus 34 – – 25 25 5
Total 165 57 39 261 6
1American’s current seating capacity includes the effect of aircraft reconfigured under the Company’s More Room Throughout Coach program.
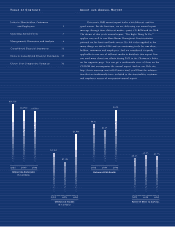
SCHEDULED RPMS AND ASM S
RPMS ASMS LOAD FACTOR
* 2000 has been adjusted for the Company’s
More Room Throughout Coach program
2000* 1999 1998
100,000
110,000
120,000
130,000
140,000
150,000
160,000
170,000
65%
70%
75%
Millions Load
Factor
SCHEDULED RPMS AND ASM S
RPMS ASMS LOAD FACTOR
* 2000 has been adjusted for the Company’s
More Room Throughout Coach program
2000* 1999 1998
100,000
110,000
120,000
130,000
140,000
150,000
160,000
170,000
65%
70%
75%
Millions Load
Factor