Apple 2013 Annual Report Download - page 33
Download and view the complete annual report
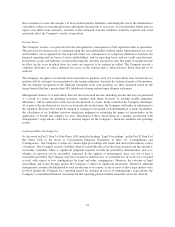
Please find page 33 of the 2013 Apple annual report below. You can navigate through the pages in the report by either clicking on the pages listed below, or by using the keyword search tool below to find specific information within the annual report.-
 1
1 -
2
-
3
-
4
-
5
-
6
-
7
-
8
-
9
-
10
-
11
-
12
-
13
-
14
-
15
-
16
-
17
-
18
-
19
-
20
-
21
-
22
-
 23
23 -
 24
24 -
 25
25 -
 26
26 -
 27
27 -
 28
28 -
 29
29 -
 30
30 -
 31
31 -
 32
32 -
 33
33 -
 34
34 -
 35
35 -
 36
36 -
 37
37 -
 38
38 -
 39
39 -
 40
40 -
 41
41 -
 42
42 -
 43
43 -
44
-
45
-
46
-
47
-
48
-
49
-
50
-
51
-
52
-
53
-
54
-
55
-
56
-
57
-
58
-
59
-
60
-
61
-
62
-
63
-
64
-
65
-
66
-
67
-
68
-
69
-
70
-
71
-
72
-
73
-
74
-
75
-
76
-
77
-
78
-
79
-
80
-
81
-
82
-
83
-
84
-
85
-
86
-
87
-
88
-
89
-
90
-
91
-
92
-
93
-
94
-
95
-
96
 |
 |

segment were also negatively impacted by the region’s uncertain economic conditions and the strength in the
U.S. dollar relative to several European currencies, including the euro.
Greater China
The following table presents Greater China net sales information for 2013, 2012 and 2011 (in millions):
2013 Change 2012 Change 2011
Net sales ........................................... $25,417 13% $22,533 78% $12,690
Percentage of total net sales ........................ 15% 14% 12%
The growth in net sales in the Greater China segment during 2013 resulted from two major iPhone introductions
during the year, iPhone 5 in December 2012 and iPhone 5c and iPhone 5s in September 2013. Further
contributing to the growth in 2013 was the introduction of the fourth generation iPad and iPad mini during the
second quarter of 2013 and an increase in iPhone channel inventory as of the end of 2013 compared to the end of
2012. While net sales in the China segment were up 13% for all of 2013, net sales for the second half of 2013
declined 4% compared to the second half of 2012.
The growth in net sales during 2012 was mainly due to increased demand for iPhone following the launch of
iPhone 4s and strong demand for the third generation iPad and iPad 2. Growth in the Greater China segment was
affected by the timing of iPhone and iPad product launches. iPhone 5 was not launched in China during 2012,
and the third generation iPad that was introduced by the Company in March 2012 was not launched in China
until the fourth quarter of 2012.
Japan
The following table presents Japan net sales information for 2013, 2012 and 2011 (in millions):
2013 Change 2012 Change 2011
Net sales ........................................... $13,462 27% $10,571 94% $ 5,437
Percentage of total net sales ........................ 8% 7% 5%
The increase in net sales in the Japan segment during 2013 reflects significant increases in unit volumes of
iPhone and iPad, strong growth of iTunes Store net sales and an increase in iPhone channel inventory as of the
end of 2013 compared to the end of 2012. These positive factors were partially offset by declines in ASPs for
iPhone and iPad and by weakness in the Japanese Yen relative to the U.S. dollar.
The growth in net sales during 2012 was primarily driven by increased demand for iPhone following the launches
of iPhone 4s and iPhone 5, expanded distribution with a new iPhone carrier, strong demand for the third
generation iPad and iPad 2, higher sales from the iTunes Store, and strength in the Japanese Yen relative to the
U.S. dollar.
Rest of Asia Pacific
The following table presents Rest of Asia Pacific net sales information for 2013, 2012 and 2011 (in millions):
2013 Change 2012 Change 2011
Net sales ........................................... $11,181 4% $10,741 8% $ 9,902
Percentage of total net sales ........................ 7% 7% 9%
The growth in net sales during 2013 was primarily driven by the launch of iPhone 5 and higher sales from
iTunes, partially offset by a decrease in net sales of iPad and Mac.
31