Apple 2013 Annual Report Download - page 51
Download and view the complete annual report
Please find page 51 of the 2013 Apple annual report below. You can navigate through the pages in the report by either clicking on the pages listed below, or by using the keyword search tool below to find specific information within the annual report.-
 1
1 -
2
-
3
-
4
-
5
-
6
-
7
-
8
-
9
-
10
-
11
-
12
-
13
-
14
-
15
-
16
-
17
-
18
-
19
-
20
-
21
-
22
-
23
-
24
-
25
-
26
-
27
-
28
-
29
-
30
-
31
-
32
-
33
-
34
-
35
-
36
-
37
-
38
-
39
-
40
-
 41
41 -
 42
42 -
 43
43 -
 44
44 -
 45
45 -
 46
46 -
 47
47 -
 48
48 -
 49
49 -
 50
50 -
 51
51 -
 52
52 -
 53
53 -
 54
54 -
 55
55 -
 56
56 -
 57
57 -
 58
58 -
 59
59 -
 60
60 -
 61
61 -
62
-
63
-
64
-
65
-
66
-
67
-
68
-
69
-
70
-
71
-
72
-
73
-
74
-
75
-
76
-
77
-
78
-
79
-
80
-
81
-
82
-
83
-
84
-
85
-
86
-
87
-
88
-
89
-
90
-
91
-
92
-
93
-
94
-
95
-
96
 |
 |

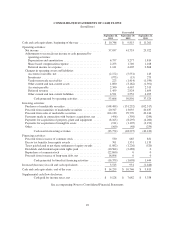
CONSOLIDATED STATEMENTS OF CASH FLOWS
(In millions)
Years ended
September 28,
2013
September 29,
2012
September 24,
2011
Cash and cash equivalents, beginning of the year ............... $ 10,746 $ 9,815 $ 11,261
Operating activities:
Net income ........................................... 37,037 41,733 25,922
Adjustments to reconcile net income to cash generated by
operating activities:
Depreciation and amortization .......................... 6,757 3,277 1,814
Share-based compensation expense ...................... 2,253 1,740 1,168
Deferred income tax expense ........................... 1,141 4,405 2,868
Changes in operating assets and liabilities:
Accounts receivable, net .............................. (2,172) (5,551) 143
Inventories ......................................... (973) (15) 275
Vendor non-trade receivables .......................... 223 (1,414) (1,934)
Other current and non-current assets ..................... 1,080 (3,162) (1,391)
Accounts payable .................................... 2,340 4,467 2,515
Deferred revenue .................................... 1,459 2,824 1,654
Other current and non-current liabilities .................. 4,521 2,552 4,495
Cash generated by operating activities ................ 53,666 50,856 37,529
Investing activities:
Purchases of marketable securities ......................... (148,489) (151,232) (102,317)
Proceeds from maturities of marketable securities ............ 20,317 13,035 20,437
Proceeds from sales of marketable securities ................. 104,130 99,770 49,416
Payments made in connection with business acquisitions, net . . . (496) (350) (244)
Payments for acquisition of property, plant and equipment ..... (8,165) (8,295) (4,260)
Payments for acquisition of intangible assets ................ (911) (1,107) (3,192)
Other ................................................ (160) (48) (259)
Cash used in investing activities .................... (33,774) (48,227) (40,419)
Financing activities:
Proceeds from issuance of common stock ................... 530 665 831
Excess tax benefits from equity awards ..................... 701 1,351 1,133
Taxes paid related to net share settlement of equity awards ..... (1,082) (1,226) (520)
Dividends and dividend equivalent rights paid ............... (10,564) (2,488) 0
Repurchase of common stock ............................ (22,860) 0 0
Proceeds from issuance of long-term debt, net ............... 16,896 0 0
Cash generated by/(used in) financing activities ........ (16,379) (1,698) 1,444
Increase/(decrease) in cash and cash equivalents ................ 3,513 931 (1,446)
Cash and cash equivalents, end of the year .................... $ 14,259 $ 10,746 $ 9,815
Supplemental cash flow disclosure:
Cash paid for income taxes, net ..................... $ 9,128 $ 7,682 $ 3,338
See accompanying Notes to Consolidated Financial Statements.
49