BP 2014 Annual Report Download - page 14
Download and view the complete annual report
Please find page 14 of the 2014 BP annual report below. You can navigate through the pages in the report by either clicking on the pages listed below, or by using the keyword search tool below to find specific information within the annual report.-
 1
1 -
2
-
3
-
 4
4 -
 5
5 -
 6
6 -
 7
7 -
 8
8 -
 9
9 -
 10
10 -
 11
11 -
 12
12 -
 13
13 -
 14
14 -
 15
15 -
 16
16 -
 17
17 -
 18
18 -
 19
19 -
 20
20 -
 21
21 -
 22
22 -
 23
23 -
 24
24 -
25
-
26
-
27
-
28
-
29
-
30
-
31
-
32
-
33
-
34
-
35
-
36
-
37
-
38
-
39
-
40
-
41
-
42
-
43
-
44
-
45
-
46
-
47
-
48
-
49
-
50
-
51
-
52
-
53
-
54
-
55
-
56
-
57
-
58
-
59
-
60
-
61
-
62
-
63
-
64
-
65
-
66
-
67
-
68
-
69
-
70
-
71
-
72
-
73
-
74
-
75
-
76
-
77
-
78
-
79
-
80
-
81
-
82
-
83
-
84
-
85
-
86
-
87
-
88
-
89
-
90
-
91
-
92
-
93
-
94
-
95
-
96
-
97
-
98
-
99
-
100
-
101
-
102
-
103
-
104
-
105
-
106
-
107
-
108
-
109
-
110
-
111
-
112
-
113
-
114
-
115
-
116
-
117
-
118
-
119
-
120
-
121
-
122
-
123
-
124
-
125
-
126
-
127
-
128
-
129
-
130
-
131
-
132
-
133
-
134
-
135
-
136
-
137
-
138
-
139
-
140
-
141
-
142
-
143
-
144
-
145
-
146
-
147
-
148
-
149
-
150
-
151
-
152
-
153
-
154
-
155
-
156
-
157
-
158
-
159
-
160
-
161
-
162
-
163
-
164
-
165
-
166
-
167
-
168
-
169
-
170
-
171
-
172
-
173
-
174
-
175
-
176
-
177
-
178
-
179
-
180
-
181
-
182
-
183
-
184
-
185
-
186
-
187
-
188
-
189
-
190
-
191
-
192
-
193
-
194
-
195
-
196
-
197
-
198
-
199
-
200
-
201
-
202
-
203
-
204
-
205
-
206
-
207
-
208
-
209
-
210
-
211
-
212
-
213
-
214
-
215
-
216
-
217
-
218
-
219
-
220
-
221
-
222
-
223
-
224
-
225
-
226
-
227
-
228
-
229
-
230
-
231
-
232
-
233
-
234
-
235
-
236
-
237
-
238
-
239
-
240
-
241
-
242
-
243
-
244
-
245
-
246
-
247
-
248
-
249
-
250
-
251
-
252
-
253
-
254
-
255
-
256
-
257
-
258
-
259
-
260
-
261
-
262
-
263
 |
 |

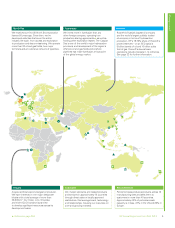
Our markets in 2014
See page 20 for information on oil and gas
prices in 2014.
Near-term outlook
Oil prices, after around four years of averaging
around $100 per barrel, have fallen by more
than 50%. This reflects strong production
growth in the US, increases in global supply
elsewhere and weaker global demand. Prices
weakened further following OPEC’s decision in
November to maintain production.
Prices are expected to remain low through the
near term, at least. And while we anticipate
supply chain deflation by 2016 and beyond, as
industry costs follow oil prices with a lag, this
will be a tough period of intense change for the
industry as it adapts to this new reality.
Long-term outlook
Population and economic growth are the main
drivers of global energy demand. The world’s
population is projected to increase by 1.6 billion
from 2013 to 2035, and the world economy is
likely to more than double in size over the same
period. Improvements to energy efficiency,
further stimulated by new climate policies and a
shift towards less energy-intensive activities in
fast-growing economies will restrain the growth
of energy consumption. But we still expect
world demand for energy to increase by as much
as 37% between 2013 and 2035, with 96% of
the growth in non-OECD countries.
Energy resources are available to meet this
growing demand, but developing these
resources presents a number of challenges:
Sustainability – action is needed to limit carbon
dioxide (CO2) and other greenhouse gases
emitted through fossil fuel use.
Supply security – more than 60% of the world’s
known reserves of natural gas are in just five
countries, and more than 80% of global oil
reserves are located in nine countries, often
distant from the hubs of energy consumption.
We believe that a diverse mix of fuels and technologies will
be essential to meet the growing demand for energy and the
challenges facing our industry.
Our market outlook
Affordability – fossil fuels can become more
difficult to access as the easiest and highest
quality resources are depleted first, and many
non-fossil fuel resources remain costly to
produce at scale.
Continued advances in technology and
energy-industry productivity are required to
deliver affordable, sustainable and secure
energy. The shale gas revolution demonstrates
the potential impact of such developments.
Effective policy
We believe governments must set a stable
framework to encourage private sector
investment and to help consumers choose
wisely. This includes secure access for the
exploration and development of energy
resources; mutual benefits for resource owners
and development partners; and an appropriate
legal and regulatory environment with an
economy-wide price on carbon.
Energy efficiency
Greater efficiency helps with affordability –
because less energy is needed; with security
– because it reduces dependence on imports;
and with sustainability – because it reduces
emissions. Innovation can play a key role in
improving technology, bringing down cost and
increasing efficiency. In transport, for example,
we believe energy-efficient technologies and
biofuels could offer the most cost-effective
pathway to a secure, lower-carbon future.
How BP is preparing for the
near-term outlook
We exercise capital discipline by
constraining the total level of capital spend
and the number of projects sanctioned each
year.
We sanction upstream projects at $80a per
barrel, while testing projects for resilience at
$60a per barrel.
Our balance sheet gives us resilience to
withstand a period of low prices.
With a third of our production from
production-sharing agreements and an
increasing portfolio of high-quality gas
projects, we are reducing our vulnerability
to global oil price movements.
We continue to right-size the group’s cost
base to align with BP’s smaller footprint.
a In real terms based to 2012.
For further detail on the projections of future
energy trends contained in this section,
please refer to BP Energy Outlook 2035.
BP Annual Report and Form 20-F 201410