BP 2014 Annual Report Download - page 15
Download and view the complete annual report
Please find page 15 of the 2014 BP annual report below. You can navigate through the pages in the report by either clicking on the pages listed below, or by using the keyword search tool below to find specific information within the annual report.-
 1
1 -
2
-
3
-
4
-
 5
5 -
 6
6 -
 7
7 -
 8
8 -
 9
9 -
 10
10 -
 11
11 -
 12
12 -
 13
13 -
 14
14 -
 15
15 -
 16
16 -
 17
17 -
 18
18 -
 19
19 -
 20
20 -
 21
21 -
 22
22 -
 23
23 -
 24
24 -
 25
25 -
26
-
27
-
28
-
29
-
30
-
31
-
32
-
33
-
34
-
35
-
36
-
37
-
38
-
39
-
40
-
41
-
42
-
43
-
44
-
45
-
46
-
47
-
48
-
49
-
50
-
51
-
52
-
53
-
54
-
55
-
56
-
57
-
58
-
59
-
60
-
61
-
62
-
63
-
64
-
65
-
66
-
67
-
68
-
69
-
70
-
71
-
72
-
73
-
74
-
75
-
76
-
77
-
78
-
79
-
80
-
81
-
82
-
83
-
84
-
85
-
86
-
87
-
88
-
89
-
90
-
91
-
92
-
93
-
94
-
95
-
96
-
97
-
98
-
99
-
100
-
101
-
102
-
103
-
104
-
105
-
106
-
107
-
108
-
109
-
110
-
111
-
112
-
113
-
114
-
115
-
116
-
117
-
118
-
119
-
120
-
121
-
122
-
123
-
124
-
125
-
126
-
127
-
128
-
129
-
130
-
131
-
132
-
133
-
134
-
135
-
136
-
137
-
138
-
139
-
140
-
141
-
142
-
143
-
144
-
145
-
146
-
147
-
148
-
149
-
150
-
151
-
152
-
153
-
154
-
155
-
156
-
157
-
158
-
159
-
160
-
161
-
162
-
163
-
164
-
165
-
166
-
167
-
168
-
169
-
170
-
171
-
172
-
173
-
174
-
175
-
176
-
177
-
178
-
179
-
180
-
181
-
182
-
183
-
184
-
185
-
186
-
187
-
188
-
189
-
190
-
191
-
192
-
193
-
194
-
195
-
196
-
197
-
198
-
199
-
200
-
201
-
202
-
203
-
204
-
205
-
206
-
207
-
208
-
209
-
210
-
211
-
212
-
213
-
214
-
215
-
216
-
217
-
218
-
219
-
220
-
221
-
222
-
223
-
224
-
225
-
226
-
227
-
228
-
229
-
230
-
231
-
232
-
233
-
234
-
235
-
236
-
237
-
238
-
239
-
240
-
241
-
242
-
243
-
244
-
245
-
246
-
247
-
248
-
249
-
250
-
251
-
252
-
253
-
254
-
255
-
256
-
257
-
258
-
259
-
260
-
261
-
262
-
263
 |
 |

A diverse mix
We believe a diverse mix of fuels and
technologies can enhance national and global
energy security while supporting the transition
to a lower-carbon economy. These are reasons
why BP’s portfolio includes oil sands, shale gas,
deepwater oil and gas and biofuels.
Oil and natural gas
Oil and natural gas are likely to play a significant
part in meeting demand for several decades.
We believe these energy sources will represent
about 54% of total energy consumption in 2035.
Even under the International Energy Agency’s
most ambitious climate policy scenario (the 450
scenarioa), oil and gas would still make up 49%
of the energy mix in 2030 and 43% in 2040.
We expect oil to remain the dominant source for
transport fuels, accounting for almost 90% of
demand in 2035.
Natural gas, in particular, is likely to play an
increasing role in meeting global energy
demand. By 2035 gas is expected to provide
26% of global energy, matching the share of
coal. Natural gas produces about half as much
CO2 as coal per unit of power generated, so
increasing the share of gas versus coal helps to
restrain greenhouse gas emissions. Shale gas
has already had a significant impact on US gas
prices and demand, and is expected to
contribute 47% of the growth in global natural
gas supplies between 2013 and 2035.
New sources of hydrocarbons may be more
difficult to reach, extract and process. BP and
others in our industry are working to improve
techniques for maximizing recovery from
existing and currently inaccessible or
undeveloped fields. In many cases, the
extraction of these resources might be more
energy-intensive, which means operating costs
and greenhouse gas emissions from operations
may also increase.
Our projections of future energy trends and
factors that could affect them, based on our
views of likely economic and population growth
and developments in policy and technology. Also
available in Excel and video format.
We provide a long-term technology view on
future trends and their potential impact on the
energy system. This helps assess lessons learned
from technology’s evolution and how it may
shape our future energy choices.
See bp.com/energyoutlook See bp.com/energy-technology-future
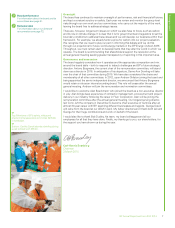
2035
18
16
14
12
10
8
6
4
2
1965 2000
*Includes biofuels.
Source: BP Energy Outlook 2035.
Hydro Coal
Renewables* Nuclear
Oil
Gas
E
nergy consumption by fuel
(
billion tonnes of oil equivalent)
E
nergy consumption by region
(
billion tonnes of oil equivalent)
2035
18
16
14
12
10
8
6
4
2
1965 2000
Source: BP Energy Outlook 2035.
Other ChinaIndia
OECD
Renewables
Renewables will play an increasingly important
role in addressing the long-term challenges of
energy security and climate change. They are
already the fastest-growing energy source, but
are starting from a low base. By 2035, we
estimate renewable energy, excluding large-
scale hydroelectricity, is likely to meet around
8% of total global energy demand.
Temporary policy support is needed to help
commercialize lower-carbon options and
technologies, but they will ultimately need to
become commercially self-sustaining, supported
only by a carbon price.
Beyond 2035
We expect that growing population and per
capita incomes will continue to drive growing
demand for energy. These dynamics will be
shaped by future technology developments,
changes in tastes, and future policy choices
– all of which are inherently uncertain. Concerns
about energy security, affordability and
environmental impacts are all likely to be
important considerations. These factors may
accelerate the trend towards more diverse
sources of energy supply, a lower average
carbon footprint, increased efficiency and
demand management.
a From World Energy Outlook 2014. © OECD/International
Energy Agency 2014, page 607. The IEA’s 450 policy scenario
assumes governments adopt commitments to limit the
long-term concentration of greenhouse gases in the
atmosphere to 450 parts-per-million of CO2 equivalent.
Our strategy
Find out how BP can help meet energy
demand for years to come on page 13.
BP Annual Report and Form 20-F 2014 11
Strategic report
11
Strategic report