Best Buy 2000 Annual Report Download - page 22
Download and view the complete annual report
Please find page 22 of the 2000 Best Buy annual report below. You can navigate through the pages in the report by either clicking on the pages listed below, or by using the keyword search tool below to find specific information within the annual report.-
 1
1 -
2
-
3
-
4
-
5
-
6
-
7
-
8
-
9
-
10
-
11
-
 12
12 -
 13
13 -
 14
14 -
 15
15 -
 16
16 -
 17
17 -
 18
18 -
 19
19 -
 20
20 -
 21
21 -
 22
22 -
 23
23 -
 24
24 -
 25
25 -
 26
26 -
 27
27 -
 28
28 -
 29
29 -
 30
30 -
 31
31 -
 32
32 -
33
-
34
-
35
-
36
-
37
-
38
-
39
-
40
-
41
-
42
-
43
-
44
-
45
-
46
-
47
-
48
-
49
-
50
-
51
-
52
 |
 |

20
Results of Operations
Fiscal 2000 was another outstanding year as the Company generated record revenues and earnings for
the third consecutive year. For the fiscal year ended February 26, 2000, net earnings increased 60%, to
$347.1 million, compared with earnings of $216.3 million in fiscal 1999. Earnings per share on a diluted
basis increased to $1.63 in fiscal 2000, compared with $1.03 in fiscal 1999 and $.46 in fiscal 1998. Continued
enhancements to its operating model enabled the Company to generate record results by capitalizing on
the ongoing strength in consumer spending and consumers’ rapid acceptance of new digital technology.
In addition to traditional financial measurements, the Company uses Economic Value Added (EVA®) to
encourage management to take actions to increase shareholder value. EVA is net operating profit after
taxes minus a charge for total capital employed. The Company generated EVA of $178 million in fiscal 2000,
compared with $75 million in fiscal 1999, a 137% year-over-year improvement. The fiscal 2000 EVA
improvement resulted from the stronger operating performance and the leveraging of capital employed
through actions such as increasing inventory turns from 6.6 in fiscal 1999 to 7.2 in fiscal 2000. In fiscal
1999, EVA also improved more than $100 million over the previous year.
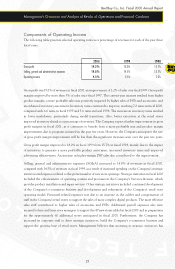
The following table presents selected revenue data for each of the past three fiscal years ($ in thousands).
2000 1999 1998
Revenues $12,494,023 $10,064,646 $ 8,337,762
Percentage increase in revenues 24.1% 20.7% 7.5%
Comparable store sales change 11.1% 13.5% 2.0%
Average revenues per store $ 37,200 $ 33,700 $ 29,600
Revenues in fiscal 2000 increased 24.1% to $12.5 billion, compared with $10.1 billion in fiscal 1999, due
to an 11.1% increase in comparable store sales, the net addition of 46 stores and a full year of operations at
the 28 stores opened in fiscal 1999. Fiscal 2000 was the second consecutive year of double-digit comparable
store sales increases. The increases, which exceeded industry comparable store sales gains, reflect the
continued strength in consumer spending and the Company’s ability to gain market share. Higher levels of
disposable income due to the strong economy, consumers’ rapid migration to digital technology and the
increased affordability of personal computers all drove consumer demand. Digital products doubled
as a percentage of sales, comprising more than 10% of sales at the end of fiscal 2000. Internet
service providers (ISPs) offered new subscribers significant rebates on purchases of personal computers,
making them more affordable. This stimulated unit sales of personal computers and sales of higher-margin
accessories and Performance Service Plans (PSPs) that accompany the purchase of a computer. The
Company believes it gained market share in fiscal 2000 as a result of a more customer-focused product assortment
and its ability to successfully bring new technology products such as Digital Versatile Disc (DVD) to
consumers. Since the launch of DVD two years ago, the Company has captured over 30% of the national
market share of DVD software sales and over 20% of DVD hardware sales.
Management’s Discussion and Analysis of Results of Operations and Financial Condition