Best Buy 2001 Annual Report Download - page 3
Download and view the complete annual report
Please find page 3 of the 2001 Best Buy annual report below. You can navigate through the pages in the report by either clicking on the pages listed below, or by using the keyword search tool below to find specific information within the annual report.-
 1
1 -
 2
2 -
 3
3 -
 4
4 -
 5
5 -
 6
6 -
 7
7 -
 8
8 -
 9
9 -
 10
10 -
 11
11 -
 12
12 -
 13
13 -
 14
14 -
15
-
16
-
17
-
18
-
19
-
20
-
21
-
22
-
23
-
24
-
25
-
26
-
27
-
28
-
29
-
30
-
31
-
32
-
33
-
34
-
35
-
36
-
37
-
38
-
39
-
40
-
41
-
42
-
43
-
44
-
45
-
46
-
47
-
48
-
49
-
50
-
51
-
52
-
53
-
54
-
55
-
56
 |
 |

Best Buy Co., Inc.
2
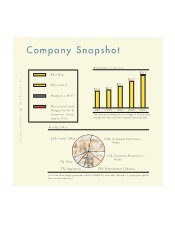
Company Snapshot
Company Snapshot
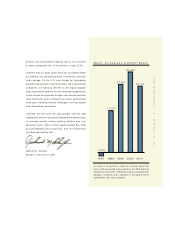
Our home office category generates a third of all Best Buy store sales, although it is growing less rapidly
than consumer electronics.
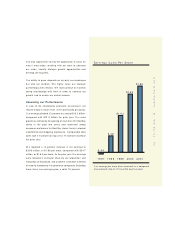
We have grown revenues by an average of 16% per year
through new stores and sales increases at existing stores.
Musicland and
Magnolia Hi-Fi
revenues since
acquisition
Revenues (in billions)
$7.8 $8.3
$10.1
$12.5
1997 1998 1999 2000 2001
$15.3
Product Mix
34% Home Office
11% Consumer Electronics –
Audio
7% Appliances 19% Entertainment Software
7% Other
22% Consumer Electronics –
Video
Best Buy
Musicland
Magnolia Hi-Fi