Best Buy 2001 Annual Report Download - page 9
Download and view the complete annual report
Please find page 9 of the 2001 Best Buy annual report below. You can navigate through the pages in the report by either clicking on the pages listed below, or by using the keyword search tool below to find specific information within the annual report.-
 1
1 -
 2
2 -
 3
3 -
 4
4 -
 5
5 -
 6
6 -
 7
7 -
 8
8 -
 9
9 -
 10
10 -
 11
11 -
 12
12 -
 13
13 -
 14
14 -
 15
15 -
 16
16 -
 17
17 -
 18
18 -
 19
19 -
 20
20 -
21
-
22
-
23
-
24
-
25
-
26
-
27
-
28
-
29
-
30
-
31
-
32
-
33
-
34
-
35
-
36
-
37
-
38
-
39
-
40
-
41
-
42
-
43
-
44
-
45
-
46
-
47
-
48
-
49
-
50
-
51
-
52
-
53
-
54
-
55
-
56
 |
 |

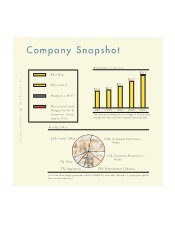
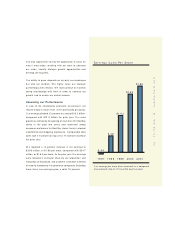
O ur earnings growth was driven by gross margin
improvements. Gross profit grew to 20.0 percent of sales,
compared with 19.2 percent the prior year. The increase
reflects improved product margins and changes in our
product mix, including higher sales of consumer electronics
and a lower contribution from the home office category.
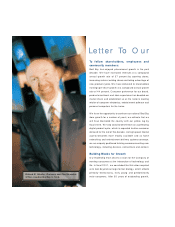
Investing in the Future
During the second quarter, we launched BestBuy.comTM,
which quickly became one of the top five e-commerce
sites in the country. Our investments in the Internet, new
stores and M usicland, along with the effects of more
moderate comparable store sales growth, raised our selling,
Best Buy Co., Inc.
6
Letter To Shareholders
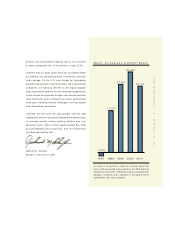
Best Buy Stock Price Relative Performance
Fiscal
Years
55.2
100.0
126.2
170.3
198.6
352.0
203.9
355.6
1,107.5 1,146.3
435.0
341.6
227.9 209.2
929.0
19971996 1998 1999 2000 2001
Best Buy
Peer Group
S&P Composite
119.1
O ur stock price has dramatically outperformed the market and an index of our peers, including retailers such as Circuit City,
Radio Shack and Home Depot.
Source: M edia General Financial Services