Ford 2003 Annual Report Download - page 4
Download and view the complete annual report
Please find page 4 of the 2003 Ford annual report below. You can navigate through the pages in the report by either clicking on the pages listed below, or by using the keyword search tool below to find specific information within the annual report.-
 1
1 -
 2
2 -
 3
3 -
 4
4 -
 5
5 -
 6
6 -
 7
7 -
 8
8 -
 9
9 -
 10
10 -
 11
11 -
 12
12 -
 13
13 -
 14
14 -
 15
15 -
16
-
17
-
18
-
19
-
20
-
21
-
22
-
23
-
24
-
25
-
26
-
27
-
28
-
29
-
30
-
31
-
32
-
33
-
34
-
35
-
36
-
37
-
38
-
39
-
40
-
41
-
42
-
43
-
44
-
45
-
46
-
47
-
48
-
49
-
50
-
51
-
52
-
53
-
54
-
55
-
56
-
57
-
58
-
59
-
60
-
61
-
62
-
63
-
64
-
65
-
66
-
67
-
68
-
69
-
70
-
71
-
72
-
73
-
74
-
75
-
76
-
77
-
78
-
79
-
80
-
81
-
82
-
83
-
84
-
85
-
86
-
87
-
88
-
89
-
90
-
91
-
92
-
93
-
94
-
95
-
96
-
97
-
98
-
99
-
100
-
101
-
102
-
103
-
104
-
105
-
106
-
107
-
108
 |
 |

A MESSAGE FROM THE CHAIRMAN
PRODUCTS AND PROGRESS
2FORD MOTOR COMPANY
Two years ago Ford Motor Company began a
determined journey toward renewed competi-
tiveness and profitability. We drew important
lessons from our past, focused on our core
automotive and automotive finance businesses,
and set out to build our future.
In 2002 we made solid progress and began
moving in the right direction. Last year the
progress continued with a growing number of
successes and the start of a massive wave of new
products. Our 2003 accomplishments include:
●Full-year net income of $495 million, or
27 cents per share, compared to a net
loss of 55 cents per share in 2002.
●Excluding special items, full-year income
from continuing operations more than
doubled to $1.14 per share.*
●An improved business structure, including
capacity reductions that made us more
efficient and aligned to the market.
●Cost reductions of $3.2 billion.**
●A year-over-year increase in per unit revenue
in North America of $724, which helped it
achieve pre-tax profits of $1.8 billion,
excluding special items.*
●Numerous successful vehicle launches,
including Ford Focus C-MAX in Europe;
Jaguar XJ and Volvo S40 worldwide; and
Ford F-150, Ford Freestar and Mercury
Monterey in North America.
●The biggest quality improvement of any
of the five major automakers, with recall
volumes reduced dramatically and warranty
spending down 18 percent from 2002. We’re
not where we want to be yet, but in the last
two years our quality has improved by more
than 16 percent.
●Agreements with the United Auto Workers
and Visteon Corporation that allow greater
operating flexibility.
●Improved operating results in South America
and Asia-Pacific.
●A return to profitability at our Premier
Automotive Group.
●A record pre-tax profit of $3 billion at
Ford Credit.
●A strong automotive cash position of
$25.9 billion.
Since our efforts began we have consistently
delivered on our financial commitments. We
exceeded earnings estimates in every quarter
of the past two years and our profit targets for
2002 and 2003. Excluding special items, our
overall financial results have improved by about
$5 billion in two years, which is ahead of plan.
In 2003 we were disappointed with our business
results in Europe and our market share in North
America. There continued to be overcapacity
worldwide among all manufacturers and, as
a result, incentives remained high. But overall
we dramatically improved our profitability and
moved closer to achieving our mid-decade goals.
By continuing to focus on improving our core
businesses and leveraging Ford’s unique
strengths, we intend to grow our business
profitably over time.
Our plans begin with great products, which have
always been the foundation of success in our
business. This year we are introducing 40 new
products worldwide. By mid-decade we will have
launched more than 150 new products, by far
the most of any similar time period in our history.
*Special items totaling $2.1 billion on a pre-tax basis were primarily related to restructuring charges at Ford Europe ($513 million) and charges at Ford North America resulting
from our agreement with Visteon ($1.6 billion).
** At constant volume, mix and currency exchange rates; excluding special items.
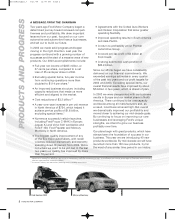
Ford Explorer NBX Mercury Monterey
EDITORIALpg1_7 3/21/04 12:48 PM Page 2