Ford 2006 Annual Report Download - page 3
Download and view the complete annual report
Please find page 3 of the 2006 Ford annual report below. You can navigate through the pages in the report by either clicking on the pages listed below, or by using the keyword search tool below to find specific information within the annual report.-
 1
1 -
 2
2 -
 3
3 -
 4
4 -
 5
5 -
 6
6 -
 7
7 -
 8
8 -
 9
9 -
 10
10 -
 11
11 -
 12
12 -
 13
13 -
 14
14 -
15
-
16
-
17
-
18
-
19
-
20
-
21
-
22
-
23
-
24
-
25
-
26
-
27
-
28
-
29
-
30
-
31
-
32
-
33
-
34
-
35
-
36
-
37
-
38
-
39
-
40
-
41
-
42
-
43
-
44
-
45
-
46
-
47
-
48
-
49
-
50
-
51
-
52
-
53
-
54
-
55
-
56
-
57
-
58
-
59
-
60
-
61
-
62
-
63
-
64
-
65
-
66
-
67
-
68
-
69
-
70
-
71
-
72
-
73
-
74
-
75
-
76
-
77
-
78
-
79
-
80
-
81
-
82
-
83
-
84
-
85
-
86
-
87
-
88
-
89
-
90
-
91
-
92
-
93
-
94
-
95
-
96
-
97
-
98
-
99
-
100
-
101
-
102
-
103
-
104
-
105
-
106
-
107
-
108
-
109
-
110
-
111
-
112
-
113
-
114
-
115
-
116
 |
 |

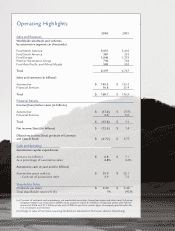
Operating Highlights
Sales and Revenues
2006
2005
Worldwide wholesale unit volumes
by automotive segment (in thousands)
Ford North America 3,051 3,410
Ford South America 381 335
Ford Europe 1,846 1,753
Premier Automotive Group 730 764
Ford Asia Pacific and Africa/Mazda 589 505
Total 6,597 6,767
Sales and revenues (in billions)
Automotive $ 143.3 $ 153.5
Financial Services 16.8 23.4
Total $ 160.1 $ 176.9
Financial Results
Income/(loss) before taxes (in billions)
Automotive $ (17.0) $
(3.9)
Financial Services 2.0 5.0
Total $ (15.0) $ 1.1
Net income/(loss) (in billions) $ (12.6) $ 1.4
Diluted net income/(loss) per share of Common
and Class B Stock $ (6.72) $ 0.77
Cash and Spending
Automotive capital expenditures
Amount (in billions) $ 6.8 $ 7.1
As a percentage of automotive sales 4.8% 4.6%
Automotive cash at year end (in billions)
Automotive gross cash (a) $ 33.9 $ 25.1
– Cash net of automotive debt 3.9 7.2
Shareholder Value
Dividends per share $ 0.25 $ 0.40
Total shareholder returns % (b) 1% (45)%
(a) Consists of cash and cash equivalents, net marketable securities, loaned securities and short-term Voluntary
Employee Beneficiary Association (VEBA) trust assets (in which $1.8 billion of financial assets were held at
the end of 2006 and $1.4 billion at the end of 2005 to pre-fund certain types of company-paid benefits for
U.S. employees and retirees).
(b) Change in value of Ford stock assuming dividends are reinvested in Ford stock. (Source: Bloomberg)
1