HP 2012 Annual Report Download - page 64
Download and view the complete annual report
Please find page 64 of the 2012 HP annual report below. You can navigate through the pages in the report by either clicking on the pages listed below, or by using the keyword search tool below to find specific information within the annual report.-
 1
1 -
2
-
3
-
4
-
5
-
6
-
7
-
8
-
9
-
10
-
11
-
12
-
13
-
14
-
15
-
16
-
17
-
18
-
19
-
20
-
21
-
22
-
23
-
24
-
25
-
26
-
27
-
28
-
29
-
30
-
31
-
32
-
33
-
34
-
35
-
36
-
37
-
38
-
39
-
40
-
41
-
42
-
43
-
44
-
45
-
46
-
47
-
48
-
49
-
50
-
51
-
52
-
53
-
 54
54 -
 55
55 -
 56
56 -
 57
57 -
 58
58 -
 59
59 -
 60
60 -
 61
61 -
 62
62 -
 63
63 -
 64
64 -
 65
65 -
 66
66 -
 67
67 -
 68
68 -
 69
69 -
 70
70 -
 71
71 -
 72
72 -
 73
73 -
 74
74 -
75
-
76
-
77
-
78
-
79
-
80
-
81
-
82
-
83
-
84
-
85
-
86
-
87
-
88
-
89
-
90
-
91
-
92
-
93
-
94
-
95
-
96
-
97
-
98
-
99
-
100
-
101
-
102
-
103
-
104
-
105
-
106
-
107
-
108
-
109
-
110
-
111
-
112
-
113
-
114
-
115
-
116
-
117
-
118
-
119
-
120
-
121
-
122
-
123
-
124
-
125
-
126
-
127
-
128
-
129
-
130
-
131
-
132
-
133
-
134
-
135
-
136
-
137
-
138
-
139
-
140
-
141
-
142
-
143
-
144
-
145
-
146
-
147
-
148
-
149
-
150
-
151
-
152
-
153
-
154
-
155
-
156
-
157
-
158
-
159
-
160
-
161
-
162
-
163
-
164
-
165
-
166
-
167
-
168
-
169
-
170
-
171
-
172
-
173
-
174
-
175
-
176
-
177
-
178
-
179
-
180
-
181
-
182
-
183
-
184
-
185
-
186
-
187
-
188
-
189
-
190
-
191
-
192
 |
 |
HEWLETT-PACKARD COMPANY AND SUBSIDIARIES
Management’s Discussion and Analysis of
Financial Condition and Results of Operations (Continued)
The increase in amortization expense in fiscal 2011 was due primarily to increased amortization of
purchased intangible assets from acquisitions completed during fiscal 2010. This increase was partially
offset by decreased amortization expenses related to certain intangible assets associated with prior
acquisitions reaching the end of their amortization periods.
For more information on our amortization of purchased intangibles assets, see Note 7 to the
Consolidated Financial Statements in Item 8, which is incorporated herein by reference.
Acquisition-Related Charges
In fiscal 2012, we recorded acquisition-related charges of $45 million. The decrease in acquisition-
related charges was due primarily to lower consulting and integration costs associated with the
Autonomy acquisition, fewer acquisitions, and lower retention bonuses associated with acquisitions
completed in fiscal 2011 and 2010.
In fiscal 2011, we recorded acquisition-related charges of $182 million. The decrease in acquisition-
related charges was due primarily to lower consulting, integration and acquisition costs associated with
the Electronic Data Systems Corporation and 3Com acquisitions, the effect of which was partially offset
by consulting and integration costs associated with the Autonomy acquisition.
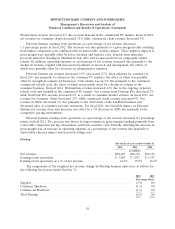
Interest and Other, Net
Interest and other, net expense increased by $181 million in fiscal 2012. The increase was driven
primarily by higher interest expense due to higher average debt balances and higher currency
transaction losses.
Interest and other, net expense increased by $190 million in fiscal 2011. The increase was driven by
$276 million of charges incurred in connection with the acquisition of Autonomy, which is primarily
comprised of the $265 million net cost of British pound options bought to limit foreign exchange rate
risk. The increase was also as a result of higher interest expenses due to higher average debt balances,
the effect of which was partially offset by lower litigation costs and lower currency transaction losses.
Provision for Taxes
Our effective tax rates were (6.0)%, 21.2% and 20.2% in fiscal 2012, 2011 and 2010, respectively.
Our effective tax rate generally differs from the U.S. federal statutory rate of 35% due to favorable tax
rates associated with certain earnings from our operations in lower-tax jurisdictions throughout the
world. The jurisdictions with favorable tax rates that have the most significant effective tax rate impact
in the periods presented include Singapore, the Netherlands, China, Ireland and Puerto Rico. We plan
to reinvest some of the earnings of these jurisdictions indefinitely outside the United States and
therefore have not provided U.S. taxes on those indefinitely reinvested earnings.
In addition to the above factors, the overall tax rates in fiscal 2012 and 2011 were impacted by
nondeductible goodwill impairments and increases in valuation allowances against certain deferred tax
assets.
For a full reconciliation of our effective tax rate to the U.S. federal statutory rate of 35% and
further explanation of our provision for taxes, see Note 14 to the Consolidated Financial Statements in
Item 8, which is incorporated herein by reference.
56