HP 2012 Annual Report Download - page 66
Download and view the complete annual report
Please find page 66 of the 2012 HP annual report below. You can navigate through the pages in the report by either clicking on the pages listed below, or by using the keyword search tool below to find specific information within the annual report.-
 1
1 -
2
-
3
-
4
-
5
-
6
-
7
-
8
-
9
-
10
-
11
-
12
-
13
-
14
-
15
-
16
-
17
-
18
-
19
-
20
-
21
-
22
-
23
-
24
-
25
-
26
-
27
-
28
-
29
-
30
-
31
-
32
-
33
-
34
-
35
-
36
-
37
-
38
-
39
-
40
-
41
-
42
-
43
-
44
-
45
-
46
-
47
-
48
-
49
-
50
-
51
-
52
-
53
-
54
-
55
-
 56
56 -
 57
57 -
 58
58 -
 59
59 -
 60
60 -
 61
61 -
 62
62 -
 63
63 -
 64
64 -
 65
65 -
 66
66 -
 67
67 -
 68
68 -
 69
69 -
 70
70 -
 71
71 -
 72
72 -
 73
73 -
 74
74 -
 75
75 -
 76
76 -
77
-
78
-
79
-
80
-
81
-
82
-
83
-
84
-
85
-
86
-
87
-
88
-
89
-
90
-
91
-
92
-
93
-
94
-
95
-
96
-
97
-
98
-
99
-
100
-
101
-
102
-
103
-
104
-
105
-
106
-
107
-
108
-
109
-
110
-
111
-
112
-
113
-
114
-
115
-
116
-
117
-
118
-
119
-
120
-
121
-
122
-
123
-
124
-
125
-
126
-
127
-
128
-
129
-
130
-
131
-
132
-
133
-
134
-
135
-
136
-
137
-
138
-
139
-
140
-
141
-
142
-
143
-
144
-
145
-
146
-
147
-
148
-
149
-
150
-
151
-
152
-
153
-
154
-
155
-
156
-
157
-
158
-
159
-
160
-
161
-
162
-
163
-
164
-
165
-
166
-
167
-
168
-
169
-
170
-
171
-
172
-
173
-
174
-
175
-
176
-
177
-
178
-
179
-
180
-
181
-
182
-
183
-
184
-
185
-
186
-
187
-
188
-
189
-
190
-
191
-
192
 |
 |

HEWLETT-PACKARD COMPANY AND SUBSIDIARIES
Management’s Discussion and Analysis of
Financial Condition and Results of Operations (Continued)
Workstations revenue decreased 3% due to weak demand in the commercial PC market. In fiscal 2012,
net revenue for consumer clients decreased 15% while commercial client revenue decreased 6%.
Personal Systems earnings from operations as a percentage of net revenue decreased
1.1 percentage points in fiscal 2012. The decrease was due primarily to a gross margin decline resulting
from higher component costs combined with an unfavorable currency impact. These negative impacts to
gross margin were partially offset by lower warranty and logistics costs, benefits from insurance
proceeds related to flooding in Thailand in July 2011 and an increased level of component vendor
rebates. In addition, operating expenses as a percentage of net revenue increased due primarily to the
decline in revenue coupled with increased investments in research and development, the effects of
which were partially offset by a decrease in administrative expenses.
Personal Systems net revenue decreased 2.9% (decreased 4.7% when adjusted for currency) in
fiscal 2011 due primarily to softness in the consumer PC markets, the effect of which was partially
offset by strength in commercial businesses. Unit volume was up 2% due primarily to the continued
commercial refresh cycle, the effect of which was partially offset by a decline in volume in the
consumer business. In fiscal 2011, Workstations revenue increased 24% due to the ongoing corporate
refresh cycle and strength in the commercial PC market. Net revenue from Desktop PCs decreased 2%
while Notebook PCs revenue decreased 6% as a result of consumer market softness. In fiscal 2011, net
revenue for consumer clients decreased 15% while commercial client revenue increased 9%. Net
revenue in Other decreased 7% due primarily to the wind down of the handheld business and
decreased sales of consumer warranty extensions. For fiscal 2011, the favorable impact on Personal
Systems net revenue from unit increases was offset by a 5% decrease in ASPs due primarily to the
competitive pricing environment.
Personal Systems earnings from operations as a percentage of net revenue increased 0.9 percentage
points in fiscal 2011. The increase was driven by improvements in gross margin resulting primarily from
a favorable component pricing environment and lower warranty costs. Partially offsetting the increase in
gross margin was an increase in operating expenses as a percentage of net revenue due primarily to
unfavorable currency impact and increased selling costs.
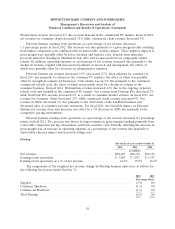
Printing
For the fiscal years ended October 31
2012 2011 2010
In millions
Net revenue ........................................... $24,487 $26,176 $26,176
Earnings from operations ................................. $ 3,585 $ 3,927 $ 4,357
Earnings from operations as a % of net revenue ................ 14.6% 15.0% 16.6%
The components of the weighted net revenue change by Printing business units were as follows for
the following fiscal years ended October 31:
2012 2011
Percentage Points
Supplies ......................................................... (3.9) 0.0
Consumer Hardware ................................................ (1.5) 0.0
Commercial Hardware ............................................... (1.1) 0.0
Total Printing ..................................................... (6.5) 0.0
58