HP 2013 Annual Report Download - page 121
Download and view the complete annual report
Please find page 121 of the 2013 HP annual report below. You can navigate through the pages in the report by either clicking on the pages listed below, or by using the keyword search tool below to find specific information within the annual report.-
 1
1 -
2
-
3
-
4
-
5
-
6
-
7
-
8
-
9
-
10
-
11
-
12
-
13
-
14
-
15
-
16
-
17
-
18
-
19
-
20
-
21
-
22
-
23
-
24
-
25
-
26
-
27
-
28
-
29
-
30
-
31
-
32
-
33
-
34
-
35
-
36
-
37
-
38
-
39
-
40
-
41
-
42
-
43
-
44
-
45
-
46
-
47
-
48
-
49
-
50
-
51
-
52
-
53
-
54
-
55
-
56
-
57
-
58
-
59
-
60
-
61
-
62
-
63
-
64
-
65
-
66
-
67
-
68
-
69
-
70
-
71
-
72
-
73
-
74
-
75
-
76
-
77
-
78
-
79
-
80
-
81
-
82
-
83
-
84
-
85
-
86
-
87
-
88
-
89
-
90
-
91
-
92
-
93
-
94
-
95
-
96
-
97
-
98
-
99
-
100
-
101
-
102
-
103
-
104
-
105
-
106
-
107
-
108
-
109
-
110
-
 111
111 -
 112
112 -
 113
113 -
 114
114 -
 115
115 -
 116
116 -
 117
117 -
 118
118 -
 119
119 -
 120
120 -
 121
121 -
 122
122 -
 123
123 -
 124
124 -
 125
125 -
 126
126 -
 127
127 -
 128
128 -
 129
129 -
 130
130 -
 131
131 -
132
-
133
-
134
-
135
-
136
-
137
-
138
-
139
-
140
-
141
-
142
-
143
-
144
-
145
-
146
-
147
-
148
-
149
-
150
-
151
-
152
-
153
-
154
-
155
-
156
-
157
-
158
-
159
-
160
-
161
-
162
-
163
-
164
-
165
-
166
-
167
-
168
-
169
-
170
-
171
-
172
-
173
-
174
-
175
-
176
-
177
-
178
-
179
-
180
-
181
-
182
-
183
-
184
-
185
-
186
-
187
-
188
-
189
-
190
-
191
-
192
-
193
-
194
-
195
-
196
-
197
-
198
-
199
-
200
-
201
-
202
-
203
-
204
 |
 |

HEWLETT-PACKARD COMPANY AND SUBSIDIARIES
Notes to Consolidated Financial Statements (Continued)
Note 8: Fair Value (Continued)
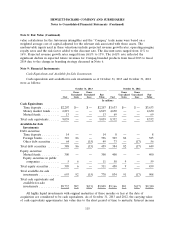
The following table presents HP’s assets and liabilities that are measured at fair value on a
recurring basis:
As of October 31, 2013 As of October 31, 2012
Fair Value Fair Value
Measured Using Measured Using
Total Total
Level 1 Level 2 Level 3 Balance Level 1 Level 2 Level 3 Balance
In millions
Assets
Time deposits ..................... $ — $2,221 $— $ 2,221 $ — $3,641 $— $3,641
Money market funds ................ 6,819 — — 6,819 4,630 — — 4,630
Mutual funds ..................... — 313 — 313 — 469 — 469
Marketable equity securities ........... 10 5 — 15 60 3 — 63
Foreign bonds ..................... 9 387 — 396 8 377 — 385
Other debt securities ................ — 2 47 49 1 — 55 56
Derivatives:
Interest rate contracts ............. — 156 — 156 — 344 — 344
Foreign exchange contracts .......... — 284 3 287 — 291 — 291
Other derivatives ................. — 9 — 9 — 1 — 1
Total Assets ................... $6,838 $3,377 $50 $10,265 $4,699 $5,126 $55 $9,880
Liabilities
Derivatives:
Interest rate contracts ............. $ — $ 107 $— $ 107 $ — $ 29 $— $ 29
Foreign exchange contracts .......... — 547 2 549 — 485 1 486
Other derivatives ................. — — — — — 3 — 3
Total Liabilities ................. $ — $ 654 $ 2 $ 656 $ — $ 517 $ 1 $ 518
For the twelve months ended October 31, 2013 and October 31, 2012, there were no material
transfers between the levels within the fair value hierarchy.
Valuation Techniques
Cash Equivalents and Investments: HP holds time deposits, money market funds, mutual funds,
other debt securities primarily consisting of corporate and foreign government notes and bonds, and
common stock and equivalents. HP values cash equivalents and equity investments using quoted market
prices, alternative pricing sources, including net asset value, or models utilizing market observable
inputs. The fair value of debt instruments were based on quoted market prices or model driven
valuations using inputs primarily derived from or corroborated by observable market data, and in
certain instances internally developed valuation models that utilize assumptions which cannot be
corroborated with observable market data.
Derivative Instruments: As discussed in Note 9, HP mainly holds non-speculative forwards, swaps
and options to hedge certain foreign currency and interest rate exposures. When prices in active
markets are not available for the identical asset or liability, HP uses industry standard valuation models
to measure fair value. Where applicable, these models project future cash flows and discount the future
amounts to present value using market-based observable inputs, including interest rate curves, HP and
counterparty credit risk, foreign exchange rates, and forward and spot prices for currencies.
113