HP 2013 Annual Report Download - page 69
Download and view the complete annual report
Please find page 69 of the 2013 HP annual report below. You can navigate through the pages in the report by either clicking on the pages listed below, or by using the keyword search tool below to find specific information within the annual report.-
 1
1 -
2
-
3
-
4
-
5
-
6
-
7
-
8
-
9
-
10
-
11
-
12
-
13
-
14
-
15
-
16
-
17
-
18
-
19
-
20
-
21
-
22
-
23
-
24
-
25
-
26
-
27
-
28
-
29
-
30
-
31
-
32
-
33
-
34
-
35
-
36
-
37
-
38
-
39
-
40
-
41
-
42
-
43
-
44
-
45
-
46
-
47
-
48
-
49
-
50
-
51
-
52
-
53
-
54
-
55
-
56
-
57
-
58
-
 59
59 -
 60
60 -
 61
61 -
 62
62 -
 63
63 -
 64
64 -
 65
65 -
 66
66 -
 67
67 -
 68
68 -
 69
69 -
 70
70 -
 71
71 -
 72
72 -
 73
73 -
 74
74 -
 75
75 -
 76
76 -
 77
77 -
 78
78 -
 79
79 -
80
-
81
-
82
-
83
-
84
-
85
-
86
-
87
-
88
-
89
-
90
-
91
-
92
-
93
-
94
-
95
-
96
-
97
-
98
-
99
-
100
-
101
-
102
-
103
-
104
-
105
-
106
-
107
-
108
-
109
-
110
-
111
-
112
-
113
-
114
-
115
-
116
-
117
-
118
-
119
-
120
-
121
-
122
-
123
-
124
-
125
-
126
-
127
-
128
-
129
-
130
-
131
-
132
-
133
-
134
-
135
-
136
-
137
-
138
-
139
-
140
-
141
-
142
-
143
-
144
-
145
-
146
-
147
-
148
-
149
-
150
-
151
-
152
-
153
-
154
-
155
-
156
-
157
-
158
-
159
-
160
-
161
-
162
-
163
-
164
-
165
-
166
-
167
-
168
-
169
-
170
-
171
-
172
-
173
-
174
-
175
-
176
-
177
-
178
-
179
-
180
-
181
-
182
-
183
-
184
-
185
-
186
-
187
-
188
-
189
-
190
-
191
-
192
-
193
-
194
-
195
-
196
-
197
-
198
-
199
-
200
-
201
-
202
-
203
-
204
 |
 |

HEWLETT-PACKARD COMPANY AND SUBSIDIARIES
Management’s Discussion and Analysis of
Financial Condition and Results of Operations (Continued)
Printing net revenue decreased 6.5% (decreased 6.3% on a constant currency basis) in fiscal 2012,
driven by broad-based consumer demand weakness in all regions. Printer unit volume declined 15%,
while ARU increased by 8%. Net revenue for Supplies decreased 6% in fiscal 2012 driven by demand
declines in all regions, the effects of which were partially offset by growth in large format printing
supplies. Net revenue for Consumer Hardware decreased 14% in fiscal 2012, due primarily to a decline
in consumer demand. Inkjet unit volume reductions of 18% were partially offset by a higher mix of
high value inkjet units reflecting an increase in ARU of 6%. Net revenue for Commercial Hardware
decreased 5% in fiscal 2012. The net revenue decline was driven by volume declines of 8%, due
primarily to a weak worldwide demand environment impacting our LaserJet printer business. These
negative impacts were offset by higher ARU of 2% and net revenue growth in both large format
printers and our managed print services business.
Printing earnings from operations as a percentage of net revenue decreased by 0.4 percentage
points in fiscal 2012. Gross margin declined in fiscal 2012 due to an unfavorable currency impact driven
by the strength of the Japanese yen and from lower ink supplies volumes as a result of demand
declines in all regions. These effects were partially offset by our focus on higher-end inkjet printers
combined with a higher mix of supplies. Operating expenses as a percentage of net revenue increased
due to the decline in revenue and investments in research and development, the effects of which were
partially offset by declines in marketing and administrative expenses.
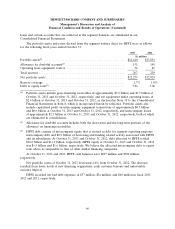
Enterprise Group
For the fiscal years ended October 31
2013 2012 2011
In millions
Net revenue ........................................... $28,183 $29,779 $31,460
Earnings from operations ................................. $ 4,301 $ 5,194 $ 6,265
Earnings from operations as a % of net revenue ................ 15.3% 17.4% 19.9%
The components of the weighted net revenue change by business units were as follows for the
following fiscal years ended October 31:
2013 2012
Percentage Points
Industry Standard Servers ............................................. (1.6) (3.0)
Business Critical Systems ............................................. (1.4) (1.5)
Technology Services ................................................. (1.3) (0.3)
Storage .......................................................... (1.1) (0.8)
Networking ....................................................... — 0.3
Total Enterprise Group .............................................. (5.4) (5.3)
EG net revenue decreased 5.4% (decreased 4.4% on a constant currency basis) in fiscal 2013 due
primarily to the macroeconomic demand challenges the business faced during the fiscal year.
Additionally, new product and technology transitions in Storage and ISS and a competitive pricing
environment contributed to the revenue decline. EG also experienced execution challenges that
impacted revenue growth in fiscal 2013, although those challenges moderated in the fourth quarter due
to improved sales execution. Each of the business units within EG experienced year-over-year revenue
declines in fiscal 2013 except Networking. ISS net revenue decreased by 4% due to competitive pricing
and soft demand. Within ISS, we experienced a revenue decline in our core mainstream products that
61