Kohl's 2000 Annual Report Download - page 17
Download and view the complete annual report
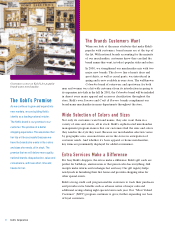
Please find page 17 of the 2000 Kohl's annual report below. You can navigate through the pages in the report by either clicking on the pages listed below, or by using the keyword search tool below to find specific information within the annual report.-
 1
1 -
2
-
3
-
4
-
5
-
6
-
 7
7 -
 8
8 -
 9
9 -
 10
10 -
 11
11 -
 12
12 -
 13
13 -
 14
14 -
 15
15 -
 16
16 -
 17
17 -
 18
18
 |
 |
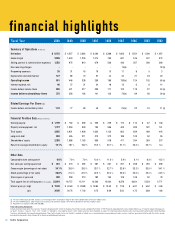
Fiscal Year 2000 1999 1998 1997 1996 1995 1994 1993 1992
Summary of Operations (In millions)
Net sales $ 6,152 $ 4,557 $ 3,682 $ 3,060 $ 2,388 $ 1,926 $ 1,554 $ 1,306 $ 1,097
Gross margin 2,096 1,543 1,235 1,014 780 631 516 437 374
Selling, general & administrative expenses 1,282 975 810 679 536 436 357 306 269
Non-recurring charges -- - - - 14(b) - - 18 (a)
Preopening expenses 35 31 16 19 10 11 8 5 3
Depreciation and amortization 127 89 70 57 44 34 27 23 20
Operating income 651 `448 338 259 189 136 (b) 124 102 65(a)
Interest expense, net 46 27 21 24 18 13 6 6 14
Income before income taxes 605 421 317 235 171 123 118 97 50(a)
Income before extraordinary items 372 258 192 141 103 73 (b) 69 56 29 (a)
Diluted Earnings Per Share (c)
Income before extraordinary items 1.10 .77 .59 .45 .34 .24(b) .23 .19 .11(a)
Financial Position Data (Dollars in millions)
Working capital $ 1,199 $ 732 $ 559 $ 525 $ 229 $ 175 $ 115 $ 87 $ 106
Property and equipment, net 1,727 1,353 933 750 596 409 299 187 141
Total assets 3,855 2,931 1,936 1,620 1,123 805 659 469 445
Long-term debt 803 495 311 310 312 188 109 52 95
Shareholders’ equity 2,203 1,686 1,163 955 518 411 334 263 207
Return on average shareholders’ equity 19.1% 18.1% 18.2% 19.2 % 22.1% 21.7% 23.0 % 23.7% n/a
Other Data
Comparable store sales growth 9.0% 7.9% 7.9 % 10.0 % 11.3 % 5.9 % 6.1 % 8.3 % 10.5 %
Net sales per selling square foot $ 281 $ 270 $ 265 $ 267 $ 261 $ 257 $ 258 $ 255 $ 239
Gross margin (percentage of net sales) 34.1% 33.9 % 33.5 % 33.1 % 32.7 % 32.8 % 33.2 % 33.5 % 34.1 %
SG&A (percentage of net sales) 20.8% 21.4 % 22.0% 22.2 % 22.4 % 22.6 % 23.0 % 23.4 % 24.5 %
Stores open at year end 320 259 213 182 150 128 108 90 79
Total square feet of selling space (In thousands) 23,610 18,757 15,111 12,533 10,064 8,378 6,824 5,523 4,771
Market price (c): High $ 72.20 $ 40.63 $ 33.88 $ 18.84 $ 10.50 $ 7.28 $ 6.91 $ 6.52 $ 4.36
Low 34.06 30.75 17.03 9.72 6.69 5.00 4.75 3.88 1.66
(a) The year ended January 30, 1993, includes a non-recurring incentive compensation charge of $17.7 million ($10.6 million after-tax) or $.04 per share.
(b) The year ended February 3, 1996, includes a non-recurring credit operations charge of $14.1 million ($8.3 million after-tax) or $.03 per share.
(c) Adjusted for stock splits in 1996, 1998 and 2000.
Forward-Looking Statements
Certain statements made within this report are “forward-looking statements” within the meaning of the Private Securities Litigation Reform Act of 1995. Forward-looking statements can be identified by the use of forward-looking terminology such
as ”plans”, “believes”, “expects”, “may”, “will”, ”should”, or “anticipates” or the negative thereof or other variations thereon. Such statements are subject to certain risks and uncertainties which could cause Kohl’s actual results to differ materially
from those anticipated by the forward-looking statements. These factors include, but are not limited to: competition, fluctuations in consumer demand, seasonal business trends, economic conditions, government activities and other factors as may
periodically be described in Kohl’s filings with the Securities and Exchange Commission.
14 Kohl’s Corporation
financial highlights