Kohl's 2000 Annual Report Download - page 4
Download and view the complete annual report
Please find page 4 of the 2000 Kohl's annual report below. You can navigate through the pages in the report by either clicking on the pages listed below, or by using the keyword search tool below to find specific information within the annual report.-
 1
1 -
 2
2 -
 3
3 -
 4
4 -
 5
5 -
 6
6 -
 7
7 -
 8
8 -
 9
9 -
 10
10 -
 11
11 -
 12
12 -
 13
13 -
 14
14 -
 15
15 -
16
-
17
-
18
 |
 |
Net Sales 2000 $ 6,152
(In millions of dollars) 1999 $ 4,557
Operating Income 2000 $ 651
(In millions of dollars) 1999 $ 448
Net Income 2000 $ 372
(In millions of dollars) 1999 $ 258
Diluted Net Income Per Share(1) 2000 $ 1.10
1999 $ 0.77
Number of Stores 2000 320
1999 259
Total Square Feet of Selling Space 2000 23,610
(At year end in thousands) 1999 18,757
Financial Highlights
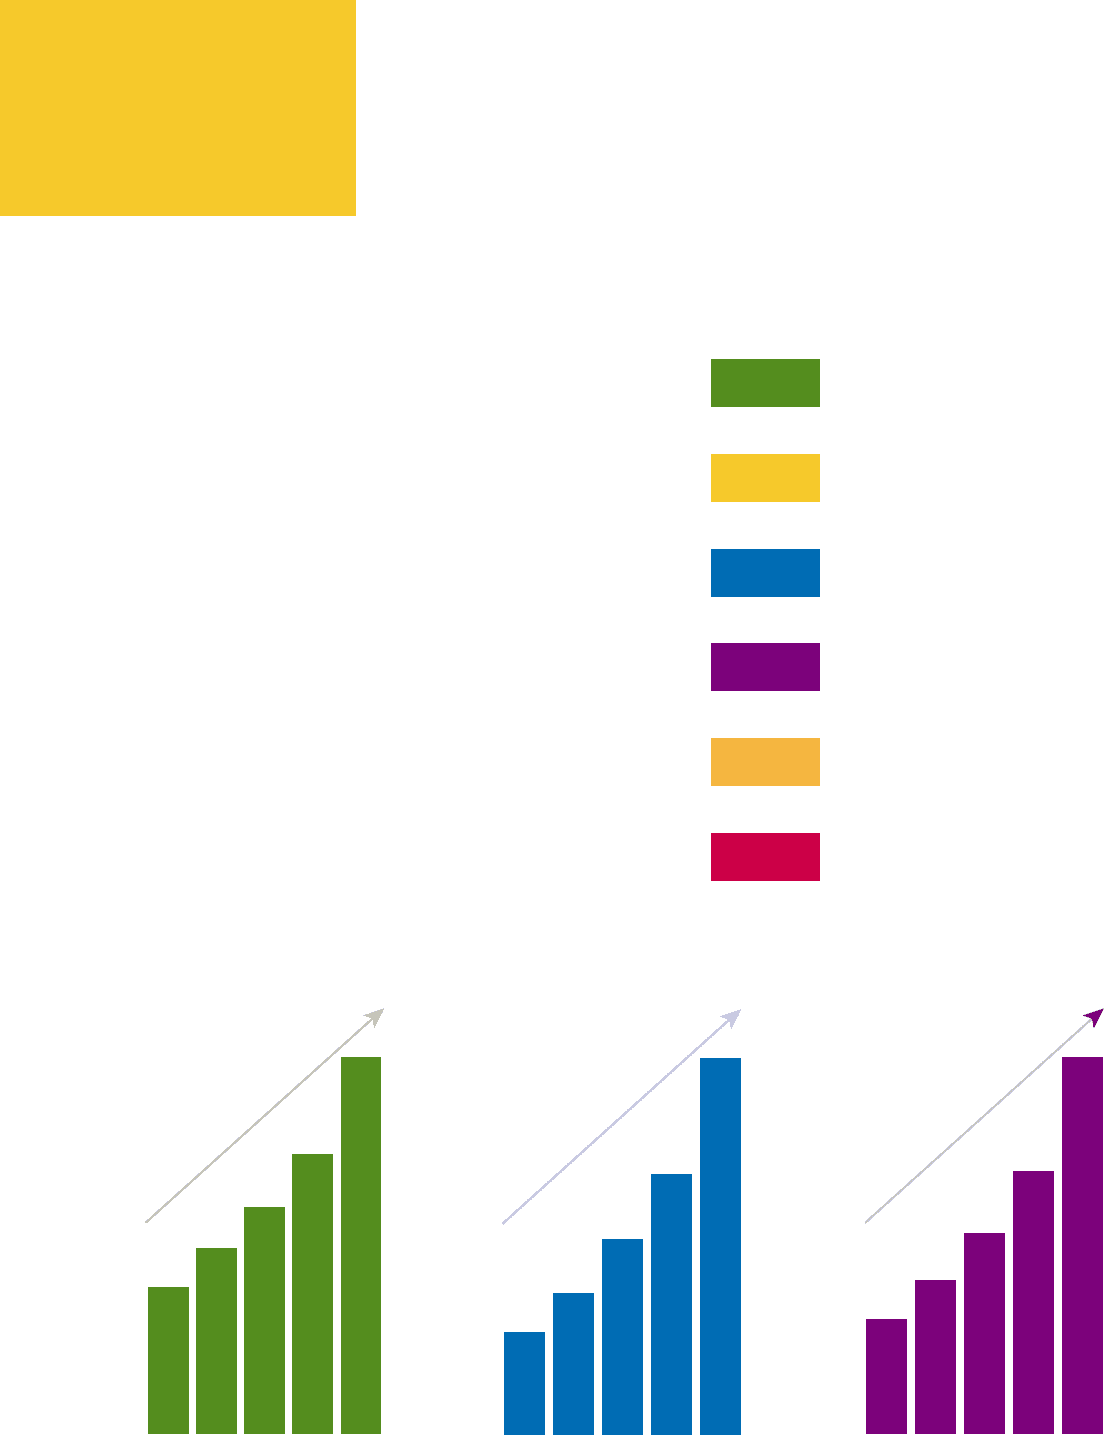
Another
Record Year
Since going public in 1992, Kohl’s has
established a record of consistently
strong financial performance. On a
compounded growth rate basis
(excluding non-recurring charges),
our net income has increased 38
percent over the last five years and
33 percent since 1992. Net income
increased 44 percent in 2000. This
was the highest percentage increase
in the last five years and our fifth
consecutive year of earnings growth
exceeding 30 percent.
up 35%
Kohl’s Corporation 1
more growth
$2,388
$3,060
$3,682
$6,152
$4,557
Net Sales
(in millions of dollars)
26.7%
CAGR*
96 97 98 99 00
$102
$141
$192
$372
$258
Net Income
(in millions of dollars)
38.2%
CAGR*
96 97 98 99 00
96 97 98 99 00
$.34
$.45
$.59
$1.10
$.77
Diluted Net Income Per Share(1)
34.1%
CAGR*
up 45%
up 44%
up 43%
up 24%
up 26%
* Compounded annual growth rate.
(1) Adjusted for stock splits in 1996, 1998 and 2000.