LabCorp 2006 Annual Report Download - page 22
Download and view the complete annual report
Please find page 22 of the 2006 LabCorp annual report below. You can navigate through the pages in the report by either clicking on the pages listed below, or by using the keyword search tool below to find specific information within the annual report.-
 1
1 -
2
-
3
-
4
-
5
-
6
-
7
-
8
-
9
-
10
-
11
-
 12
12 -
 13
13 -
 14
14 -
 15
15 -
 16
16 -
 17
17 -
 18
18 -
 19
19 -
 20
20 -
 21
21 -
 22
22 -
 23
23 -
 24
24 -
 25
25 -
 26
26 -
 27
27 -
 28
28 -
 29
29 -
 30
30 -
 31
31 -
 32
32 -
33
-
34
-
35
-
36
-
37
-
38
-
39
-
40
-
41
-
42
-
43
-
44
-
45
-
46
-
47
-
48
-
49
-
50
-
51
-
52
-
53
-
54
-
55
-
56
 |
 |

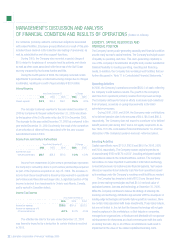
MANAGEMENT’S DISCUSSION AND ANALYSIS
OF FINANCIAL CONDITION AND RESULTS OF OPERATIONS (Dollars in millions)
............................... ........
.......................................
20 Laboratory Corporation of America® Holdings 2006
GENERAL
During 2006, the Company continued to strengthen its financial
performance through the implementation of the Company’s strategic
plan and the expansion of its national platform in routine testing. This
plan continues to provide growth opportunities for the Company by
building a leadership position in genomic and other advanced testing
technologies primarily through internal development efforts, acquisi-
tions and technology licensing activities.
The Company continues to have strong relationships with
national managed care organizations such as Aetna, Cigna, Humana,
UnitedHealthcare, and Wellpoint. These relationships were a major driver
of volume growth this year is a result of managed care relationships.
On October 3, 2006, the Company announced that it has entered into
a new, ten-year agreement with UnitedHealthcare Insurance Company
(UnitedHealthcare), effective January 1, 2007. Under the terms of
the Agreement, the Company became UnitedHealthcare’s exclusive
national laboratory, offering a comprehensive suite of services, and
will also work with other regional and local laboratory providers to
selectively develop, implement and manage for UnitedHealthcare a
series of laboratory networks in selected regions across the United
States. As part of this network development and oversight process,
the Company assumed responsibility for managing the Oxford Health
Plans laboratory network located in the greater New York metropolitan
region effective January 1, 2007. Also effective January 1, 2007, the
Company became the exclusive national capitated UnitedHealthcare
laboratory provider for the HMO benefit plans of PacifiCare of Colorado,
Neighborhood Health Partnership in Florida, and Mid Atlantic Medical
Services, L.L.C. (MAMSI) in Maryland and Virginia, and will remain
the exclusive provider for HMO benefit plans for PacifiCare of Arizona.
Over a period of several years, the Company will continue to perform
more of UnitedHealthcare’s testing. During the first three years of
the ten-year agreement, the Company has committed to reimburse
UnitedHealthcare up to $200 for transition costs related to developing
an expanded network in the Oxford, MAMSI and Neighborhood Health
Partnership markets, as well as in California and Colorado.
Over the term of the agreement, the Company expects to realize
additional revenues in excess of $3 billion from UnitedHealthcare and
associated business. In anticipation of the additional volume from this
agreement, as of January 1, 2007, the Company has opened over
four hundred patient access points and hired over twelve hundred
employees, including phlebotomists, couriers, laboratory technicians
and sales people. In addition, the company has invested approximately
$16.0 in capital projects relating to the United Healthcare contract.
Seasonality
The majority of the Company’s testing volume is dependent on patient
visits to doctor’s offices and other providers of health care. Volume
of testing generally declines during the year-end holiday periods and
other major holidays. In addition, volume declines due to inclement
weather may reduce net revenues and cash flows. Therefore,
comparison of the results of successive quarters may not accurately
reflect trends or results for the full year.
RESULTS OF OPERATIONS
Years ended December 31, 2006, 2005, and 2004
Net Sales
Years Ended December 31, % Change
2006 2005 2004 2006 2005
Net sales
Routine Testing $2,347.6 $2,197.8 $2,118.3 6.8% 3.8%
Genomic and
Esoteric 1,243.2 1,129.8 966.5 10.0% 16.9%
Total $3,590.8 $3,327.6 $3,084.8 7.9% 7.9%
Number of Accessions
Years Ended December 31, % Change
2006 2005 2004 2006 2005
Volume
Routine Testing 76.7 74.8 75.3 2.6% (0.7%)
Genomic and
Esoteric 18.8 17.3 15.8 8.6% 9.5%
Total 95.5 92.1 91.1 3.7% 1.1%
Price Per Accession (PPA)
Years Ended December 31, % Change
2006 2005 2004 2006 2005
Price
Routine Testing $30.60 $29.38 $28.12 4.1% 4.5%
Genomic and
Esoteric $66.14 $65.26 $61.18 1.3% 6.7%
Total $37.59 $36.12 $33.86 4.1% 6.7%
The increase in net sales for the three years ended December 31,
2006 has been driven primarily by the Company’s continued shift in
test mix to higher priced genomic and esoteric tests and the impact of
acquisitions. As a percentage of total net sales, genomic and esoteric
tests have increased during the three year period ended December 31,
2006 from 31.3% in 2004 to 34.6% in 2006. The acquisitions of US
Labs and Esoterix in 2005 have helped to build on the Company’s
leadership position in the genomic and esoteric market. In addition
to a shift in test mix, net sales were positively impacted in 2006 by
improved pricing and volume in routine testing.