LabCorp 2006 Annual Report Download - page 37
Download and view the complete annual report
Please find page 37 of the 2006 LabCorp annual report below. You can navigate through the pages in the report by either clicking on the pages listed below, or by using the keyword search tool below to find specific information within the annual report.-
 1
1 -
2
-
3
-
4
-
5
-
6
-
7
-
8
-
9
-
10
-
11
-
12
-
13
-
14
-
15
-
16
-
17
-
18
-
19
-
20
-
21
-
22
-
23
-
24
-
25
-
26
-
 27
27 -
 28
28 -
 29
29 -
 30
30 -
 31
31 -
 32
32 -
 33
33 -
 34
34 -
 35
35 -
 36
36 -
 37
37 -
 38
38 -
 39
39 -
 40
40 -
 41
41 -
 42
42 -
 43
43 -
 44
44 -
 45
45 -
 46
46 -
 47
47 -
48
-
49
-
50
-
51
-
52
-
53
-
54
-
55
-
56
 |
 |

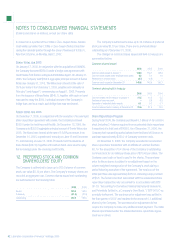
NOTES TO CONSOLIDATED FINANCIAL STATEMENTS
(Dollars and shares in millions, except per share data)
Laboratory Corporation of America® Holdings 2006 35
............................... ........
.......................................
The Company maintains cash and cash equivalents with various major
financial institutions. The total cash balances on deposit that exceeded the
balances insured by the F.D.I.C., were approximately $15.3 at December 31,
2006. Cash equivalents at December 31, 2006, totaled $46.0, which
includes amounts invested in treasury bills and short-term bonds.
Substantially all of the Company’s accounts receivable are with
companies and individuals in the health care industry. However, concentra-
tions of credit risk are limited due to the number of the Company’s clients
as well as their dispersion across many different geographic regions.
Accounts receivable balances (gross) from Medicare and Medicaid
were $99.3 and $105.4 at December 31, 2006 and 2005, respectively.
Earnings per Share:
Basic earnings per share is computed by dividing net earnings, less
preferred stock dividends and accretion, by the weighted-average
number of common shares outstanding. Diluted earnings per share
is computed by dividing net earnings including the impact of dilutive
adjustments by the weighted-average number of common shares
outstanding plus potentially dilutive shares, as if they had been issued
at the beginning of the period presented. Potentially dilutive common
shares result primarily from the Company’s outstanding stock options,
restricted stock awards, performance share awards, and shares issu-
able upon conversion of zero-coupon subordinated notes.
The following represents a reconciliation of basic earnings per share to diluted earnings per share:
2006 2005 2004
Per Share Per Share Per Share
(shares in millions) Income Shares Amount Income Shares Amount Income Shares Amount
Basic earnings per share: $431.6 124.1 $3.48 $386.2 133.5 $2.89 $363.0 139.4 $2.60
Stock options – 1.3 – 1.0 – 0.9
Restricted stock awards and other – 0.7 – 0.4 – 0.4
Interest on convertible debt, net of tax 5.3 8.6 6.5 10.0 6.2 10.0
Diluted earnings per share: $436.9 134.7 $3.24 $392.7 144.9 $2.71 $369.2 150.7 $2.45
The following table summarizes the potential common shares
not included in the computation of diluted earnings per share because
their impact would have been antidilutive:
Years Ended December 31,
2006 2005 2004
Stock options 1.1 – 1.5
Stock Compensation Plans:
Effective January 1, 2006, the Company adopted Statement of Financial
Accounting Standards No. 123 (revised 2004), Share-Based Payment
(“SFAS 123(R)”), which requires the Company to measure the cost
of employee services received in exchange for all equity awards
granted, based on the fair market value of the award as of the grant
date. SFAS 123(R) supersedes Statement of Financial Accounting
Standards No. 123, Accounting for Stock-Based Compensation
and Accounting Principles Board Opinion No. 25, Accounting for
Stock Issued to Employees (“APB 25”). The Company has adopted
SFAS 123(R) using the modified prospective application method
of adoption which requires the Company to record compensation
cost related to unvested stock awards as of December 31, 2005 by
recognizing the unamortized grant date fair value of these awards
over the remaining service periods of those awards with no change
in historical reported earnings. Awards granted after December 31,
2005 are valued at fair value in accordance with provisions of SFAS
123(R) and recognized on a straight line basis over the service
periods of each award. The Company calculated forfeiture rates for
2006 based on its historical experience.
Prior to 2006, the Company accounted for stock-based compensa-
tion in accordance with APB 25 using the intrinsic value method, which
did not require that compensation cost be recognized for the Company’s
stock option and stock purchase plans provided the option exercise price
was established at the common stock fair market value on the date of
grant. Under APB 25, the Company was required to record expense over
the vesting period for the value of its restricted stock and performance
share awards. Prior to 2006, the Company provided pro forma disclosure
amounts in accordance with SFAS No. 148, “Accounting for Stock-Based
Compensation – Transition and Disclosure” (SFAS No. 148), as if the
fair value method defined by SFAS No. 123 had been applied to all of its
stock-based compensation.
As a result of adopting SFAS 123(R), the Company’s net earnings
were reduced by $13.9 ($23.3 on a pre-tax basis). The impact on
both basic and diluted earnings per share for the year ended Decem-
ber 31, 2006 was $0.11 per share. In addition, in connection with
the adoption of SFAS 123R, net cash provided by operating activities
decreased and net cash provided by financing activities increased
for the year ended December 31, 2006 by $9.1 related to excess tax
benefits from stock-based compensation arrangements.