LabCorp 2006 Annual Report Download - page 24
Download and view the complete annual report
Please find page 24 of the 2006 LabCorp annual report below. You can navigate through the pages in the report by either clicking on the pages listed below, or by using the keyword search tool below to find specific information within the annual report.-
 1
1 -
2
-
3
-
4
-
5
-
6
-
7
-
8
-
9
-
10
-
11
-
12
-
13
-
 14
14 -
 15
15 -
 16
16 -
 17
17 -
 18
18 -
 19
19 -
 20
20 -
 21
21 -
 22
22 -
 23
23 -
 24
24 -
 25
25 -
 26
26 -
 27
27 -
 28
28 -
 29
29 -
 30
30 -
 31
31 -
 32
32 -
 33
33 -
 34
34 -
35
-
36
-
37
-
38
-
39
-
40
-
41
-
42
-
43
-
44
-
45
-
46
-
47
-
48
-
49
-
50
-
51
-
52
-
53
-
54
-
55
-
56
 |
 |

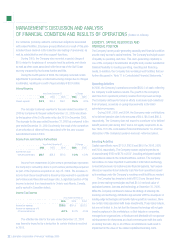
MANAGEMENT’S DISCUSSION AND ANALYSIS
OF FINANCIAL CONDITION AND RESULTS OF OPERATIONS (Dollars in millions)
............................... ........
.......................................
22 Laboratory Corporation of America® Holdings 2006
the remainder primarily related to contractual obligations associated
with leased facilities. Employee groups affected as a result of this plan
included those involved in the collection and testing of specimens, as
well as administrative and other support functions.
During 2005, the Company also recorded a special charge of
$5.0 related to forgiveness of amounts owed by patients and clients
as well as other costs associated with the areas of the Gulf Coast
severely impacted by hurricanes Katrina and Rita.
During the fourth quarter of 2004, the Company recorded certain
adjustments to previously recorded restructuring charges due to changes
in estimates, resulting in a credit of approximately of $0.9 million.
Interest Expense
Years Ended December 31, % Change
2006 2005 2004 2006 2005
Interest expense $47.8 $34.4 $36.1 39.0% (4.7%)
The increase in interest expense for the year ended December 31,
2006 as compared to the year ended December 31, 2005 was driven
by the issuance of the 5 5/8% senior notes due 2015 in December 2005.
The decrease for the year ended December 31, 2005 as compared to the
year ended December 31, 2004 is primarily the result of the completion
of amortization of deferred fees associated with the zero-coupon
subordinated notes in 2004.
Income from Joint Venture Partnerships
Years Ended December 31, % Change
2006 2005 2004 2006 2005
Income from joint
venture partnerships $66.7 $58.3 $51.3 14.4% 13.6%
Income from investments in joint venture partnerships represents
the Company’s ownership share in joint venture partnerships acquired
as part of the Dynacare acquisition on July 25, 2002. The increase in
income from these investments is driven by improvement in operational
performance and favorable exchange rates. A significant portion of this
income is derived from investments in Ontario and Alberta, Canada,
and is earned in Canadian dollars.
Income Tax Expense
Years Ended December 31,
2006 2005 2004
Income tax expense $289.3 $254.5 $252.3
Income tax expense as a %
of income before tax 40.1% 39.7% 41.0%
The effective tax rate for the year ended December 31, 2005
was favorably impacted by a deduction for certain dividends received
in 2005.
LIQUIDITY, CAPITAL RESOURCES AND
FINANCIAL POSITION
The Company’s strong cash-generating capability and financial condition
provide ready access to capital markets. The Company’s principal source
of liquidity is operating cash flow. This cash-generating capability is
one of the Company’s fundamental strengths and provides substantial
financial flexibility in meeting operating, investing and financing
needs. In addition, the Company has revolving credit facilities that are
further discussed in “Note 11 to Consolidated Financial Statements.”
Operating Activities
In 2006, the Company’s operations provided $632.3 of cash, reflecting
the Company’s solid business results. The growth in the Company’s
cash flow from operations primarily resulted from improved earnings.
The Company continued to focus on efforts to increase cash collections
from all payers, as well as on-going improvements to the claim
submission processes.
During 2006, 2005 and 2004, the Company made contributions
to its defined pension plan in the amounts of $0.0, $8.0 and $60.3,
respectively. The Company does not expect to contribute to its defined
benefit pension plan during 2007 and is not legally required to do so.
See “Note 16 to the Consolidated Financial Statements” for a further
discussion of the Company’s pension and post-retirement plans.
Investing Activities
Capital expenditures were $115.9, $93.6 and $95.0 for 2006, 2005
and 2004, respectively. The Company expects capital expenditures
of approximately $130 to $170 in 2007, including anticipated capital
expenditures related to the UnitedHealthcare contract. The Company
will continue to make important investments in information technology
connectivity between its customers and financial systems. Such expen-
ditures are expected to be funded by cash flow from operations as well
as borrowings under the Company’s revolving credit facilities as needed.
The Company has invested a total of $13.9 over the past three
years in new testing technologies and had $51.0 net book value of
capitalized patents, licenses and technology at December 31, 2006.
While the Company continues to believe its strategy of entering into
licensing and technology distribution agreements with the developers of
leading-edge technologies will provide future growth in revenues, there
are certain risks associated with these investments. These risks include,
but are not limited to, the risk that the licensed technology will not gain
broad acceptance in the marketplace; or that insurance companies,
managed care organizations, or Medicare and Medicaid will not approve
reimbursement for these tests at a level commensurate with the costs
of running the tests. Any or all of these circumstances could result in
impairment in the value of the related capitalized licensing costs.