Loreal 2011 Annual Report Download - page 106
Download and view the complete annual report
Please find page 106 of the 2011 Loreal annual report below. You can navigate through the pages in the report by either clicking on the pages listed below, or by using the keyword search tool below to find specific information within the annual report.-
 1
1 -
2
-
3
-
4
-
5
-
6
-
7
-
8
-
9
-
10
-
11
-
12
-
13
-
14
-
15
-
16
-
17
-
18
-
19
-
20
-
21
-
22
-
23
-
24
-
25
-
26
-
27
-
28
-
29
-
30
-
31
-
32
-
33
-
34
-
35
-
36
-
37
-
38
-
39
-
40
-
41
-
42
-
43
-
44
-
45
-
46
-
47
-
48
-
49
-
50
-
51
-
52
-
53
-
54
-
55
-
56
-
57
-
58
-
59
-
60
-
61
-
62
-
63
-
64
-
65
-
66
-
67
-
68
-
69
-
70
-
71
-
72
-
73
-
74
-
75
-
76
-
77
-
78
-
79
-
80
-
81
-
82
-
83
-
84
-
85
-
86
-
87
-
88
-
89
-
90
-
91
-
92
-
93
-
94
-
95
-
 96
96 -
 97
97 -
 98
98 -
 99
99 -
 100
100 -
 101
101 -
 102
102 -
 103
103 -
 104
104 -
 105
105 -
 106
106 -
 107
107 -
 108
108 -
 109
109 -
 110
110 -
 111
111 -
 112
112 -
 113
113 -
 114
114 -
 115
115 -
 116
116 -
117
-
118
-
119
-
120
-
121
-
122
-
123
-
124
-
125
-
126
-
127
-
128
-
129
-
130
-
131
-
132
-
133
-
134
-
135
-
136
-
137
-
138
-
139
-
140
-
141
-
142
-
143
-
144
-
145
-
146
-
147
-
148
-
149
-
150
-
151
-
152
-
153
-
154
-
155
-
156
-
157
-
158
-
159
-
160
-
161
-
162
-
163
-
164
-
165
-
166
-
167
-
168
-
169
-
170
-
171
-
172
-
173
-
174
-
175
-
176
-
177
-
178
-
179
-
180
-
181
-
182
-
183
-
184
-
185
-
186
-
187
-
188
-
189
-
190
-
191
-
192
-
193
-
194
-
195
-
196
-
197
-
198
-
199
-
200
-
201
-
202
-
203
-
204
-
205
-
206
-
207
-
208
-
209
-
210
-
211
-
212
-
213
-
214
-
215
-
216
-
217
-
218
-
219
-
220
-
221
-
222
-
223
-
224
-
225
-
226
-
227
-
228
-
229
-
230
-
231
-
232
-
233
-
234
-
235
-
236
-
237
-
238
-
239
-
240
-
241
-
242
-
243
-
244
-
245
-
246
 |
 |

104 REGISTRATION DOCUMENT − L’ORÉAL 2011
42011 Consolidated Financial Statements
Notes to the consolidated nancial statements
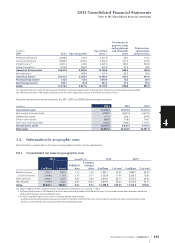
3.2.2. Cosmetics net sales by geographic zone
2011 Growth (%) 2010 2009(1)
€ millions % of total
Published
data
Excluding
exchange
effect € millions % of total € millions % of total
Western Europe 7,246.6 38.4% 0.9% 0.5% 7,181.0 39.6% 6,998.1 43.0%
of which France 2,355.7 12.5% 4.0% 4.0% 2,264.9 12.5% 2,174.6 13.4%
North America 4,406.2 23.3% 2.7% 7.2% 4,291.5 23.7% 3,813.3 23.5%
New Markets 7,218.0 38.2% 8.3% 9.5% 6,666.6 36.8% 5,445.8 33.5%
Asia, Pacific 3,619.5 19.2% 13.4% 12.9% 3,192.2 17.6% 2,597.9 16.0%
Eastern Europe 1,336.9 7.1% -4.4% -2.9% 1,398.9 7.7% 1,212.8 7.5%
Latin America 1,680.9 8.9% 10.8% 13.1% 1,517.7 8.4% 1,144.8 7.0%
Africa, Middle East 580.7 3.1% 4.1% 10.3% 557.8 3.1% 490.2 3.0%
Cosmetics branch 18,870.8 100.0% 4.0% 5.4% 18,139.1 100.0% 16,257.2 100.0%
(1) Data for 2009 have been restated to reflect the following modifications as of January1st, 2010:
♦the Travel Retail business of YSL Beauté, all of which was previously recorded within Western Europe, has now been broken down between the Western
Europe, North America and New Markets zones;
♦the Rest of the World zone is now known as the New Markets zone. However:
- Australia, India and New Zealand, previously included in the Africa, Orient, Pacific zone, are included in the Asia zone (now the Asia, Pacific zone),
- the Africa, Orient, Pacific zone has become the Africa, Middle East zone.
3.2.3. Breakdown of operating profit of Cosmetics branch by geographic Zone
€ millions
2011 2010 2009(1)
Western Europe 1,512.3 1,552.0 1,472.2
North America 810.1 708.5 554.8
New Markets 1,328.1 1,124.8 893.8
Cosmetics Divisions total 3,650.6 3,385.3 2,920.8
Non-allocated -546.2 -512.9 -482.0
Cosmetics branch 3,104.4 2,872.4 2,438.8
(1) Data for 2009 have been restated to reflect the following modifications as of January1st, 2010:
♦the Travel Retail business of YSL Beauté, all of which was previously recorded within Western Europe, has now been broken down between the Western
Europe, North America and New Markets zones;
♦the Rest of the World zone is now known as the New Markets zone. However:
- Australia, India and New Zealand, previously included in the Africa, Orient, Pacific zone, are included in the Asia zone (now the Asia, Pacific zone),
- the Africa, Orient, Pacific zone has become the Africa, Middle East zone.
3.2.4. Breakdown of operational assets and consolidated investments by geographic Zone
€ millions
2011 2010 2009(1)
Operational
assets
Investments in
property, plant
and equipment
and intangible
assets
Operational
assets
Investments in
property, plant
and equipment
and intangible
assets
Operational
assets
Investments in
property, plant
and equipment
and intangible
assets
Western Europe 8,213.4 271.5 7,743.9 215.2 7,585.5 254.8
North America 4,486.9 190.4 3,981.2 167.8 3,606.9 153.1
New Markets 3,538.0 294.3 3,090.8 202.0 2,555.3 139.7
Non-allocated 511.7 107.6 396.1 106.1 371.6 53.2
Group 16,750.0 863.7 15,212.0 691.1 14,119.3 600.8
(1) Data for 2009 have been restated to reflect the following modifications as of January1st, 2010:
♦the Travel Retail business of YSL Beauté, all of which was previously recorded within Western Europe, has now been broken down between the Western
Europe, North America and New Markets zones;
♦the Rest of the World zone is now known as the New Markets zone. However:
- Australia, India and New Zealand, previously included in the Africa, Orient, Pacific zone, are included in the Asia zone (now the Asia, Pacific zone),
- the Africa, Orient, Pacific zone has become the Africa, Middle East zone.