Microsoft 2009 Annual Report Download - page 5
Download and view the complete annual report
Please find page 5 of the 2009 Microsoft annual report below. You can navigate through the pages in the report by either clicking on the pages listed below, or by using the keyword search tool below to find specific information within the annual report.-
 1
1 -
 2
2 -
 3
3 -
 4
4 -
 5
5 -
 6
6 -
 7
7 -
 8
8 -
 9
9 -
 10
10 -
 11
11 -
 12
12 -
 13
13 -
 14
14 -
 15
15 -
 16
16 -
17
-
18
-
19
-
20
-
21
-
22
-
23
-
24
-
25
-
26
-
27
-
28
-
29
-
30
-
31
-
32
-
33
-
34
-
35
-
36
-
37
-
38
-
39
-
40
-
41
-
42
-
43
-
44
-
45
-
46
-
47
-
48
-
49
-
50
-
51
-
52
-
53
-
54
-
55
-
56
-
57
-
58
-
59
-
60
-
61
-
62
-
63
-
64
-
65
-
66
-
67
-
68
-
69
-
70
-
71
-
72
-
73
-
74
-
75
-
76
-
77
-
78
-
79
-
80
-
81
-
82
-
83
-
84
 |
 |

PAGE 5
SELECTED FINANCIAL DATA, QUARTERLY STOCK PRICE INFORMATION,
ISSUER PURCHASES OF EQUITY SECURITIES, DIVIDENDS, AND STOCK PERFORMANCE
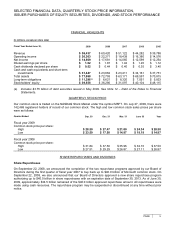
FINANCIAL HIGHLIGHTS
(In millions, except per share data)
Fiscal Year Ended June 30, 2009 2008 2007
2006 2005
Revenue $58,437 $60,420 $51,122
$ 44,282 $39,788
Operating income $20,363 $22,271 $18,438
$ 16,380 $14,576
Net income $14,569 $17,681 $14,065
$ 12,599 $12,254
Diluted earnings per share $1.62 $1.87 $1.42
$ 1.20 $1.12
Cash dividends declared per share $0.52 $0.44 $0.40
$ 0.35 $3.40
Cash and cash equivalents and short-term
investments $31,447 $23,662 $23,411
$ 34,161 $37,751
Total assets $77,888 $72,793 $63,171
$ 69,597 $70,815
Long-term obligations $11,296 (a) $6,621 $8,320
$ 7,051 $5,823
Stockholders’ equity $39,558 $36,286 $31,097
$ 40,104 $48,115
(a) Includes $3.75 billion of debt securities issued in May 2009. See Note 12 – Debt of the Notes to Financial
Statements.
QUARTERLY STOCK PRICE
Our common stock is traded on the NASDAQ Stock Market under the symbol MSFT. On July 27, 2009, there were
142,468 registered holders of record of our common stock. The high and low common stock sales prices per share
were as follows:
Quarter Ended Sep. 30 Dec. 31 Mar. 31
June 30 Year
Fiscal year 2009
Common stock price per share:
High $28.50 $27.47 $21.00 $ 24.34 $28.50
Low $23.50 $17.50 $14.87 $ 18.18 $14.87
Fiscal year 2008
Common stock price per share:
High $31.84 $37.50 $35.96 $ 32.10 $37.50
Low $27.51 $29.29 $26.87 $ 27.11 $26.87
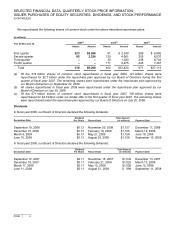
SHARE REPURCHASES AND DIVIDENDS
Share Repurchases
On September 22, 2008, we announced the completion of the two repurchase programs approved by our Board of
Directors during the first quarter of fiscal year 2007 to buy back up to $40.0 billion of Microsoft common stock. On
September 22, 2008, we also announced that our Board of Directors approved a new share repurchase program
authorizing up to $40.0 billion in share repurchases with an expiration date of September 30, 2013. As of June 30,
2009, approximately $34.5 billion remained of the $40.0 billion approved repurchase amount. All repurchases were
made using cash resources. The repurchase program may be suspended or discontinued at any time without prior
notice.