Regions Bank 2014 Annual Report Download - page 20
Download and view the complete annual report
Please find page 20 of the 2014 Regions Bank annual report below. You can navigate through the pages in the report by either clicking on the pages listed below, or by using the keyword search tool below to find specific information within the annual report.-
 1
1 -
2
-
3
-
4
-
5
-
6
-
7
-
8
-
9
-
 10
10 -
 11
11 -
 12
12 -
 13
13 -
 14
14 -
 15
15 -
 16
16 -
 17
17 -
 18
18 -
 19
19 -
 20
20 -
 21
21
 |
 |

19 REGIONS 2014 ANNUAL REVIEW
(In millions, except per-share data) 2014 2013 2012
EARNINGS SUMMARY
Income from continuing operations available to common shareholders $ 1,090 $ 1,103 $ 1,050
Net income available to common shareholders 1,103 1,090 991
Earnings per common share from continuing operations – diluted 0.79 0.78 0.76
Earnings per common share – diluted 0.80 0.77 0.71
BALANCE SHEET SUMMARY
At year-end
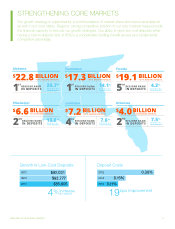
Loans, net of unearned income $ 77,307 $ 74,609 $ 73,995
Assets 119,679 117,396 121,347
Deposits 94,200 92,453 95,474
Long-term debt 3,462 4,830 5,861
Stockholders’ equity 16,989 15,768 15,499
Average balances – continuing operations
Loans, net of unearned income $ 76,253 $ 74,924 $ 76,035
Assets 118,468 117,805 122,182
Deposits 93,481 92,646 95,330
Long-term debt 4,057 5,206 6,694
Stockholders’ equity 16,725 15,502 15,035
SELECTED RATIOS
Allowance for loan losses as a percentage of loans, net of unearned income 1.43% 1.80% 2.59%
Tier 1 capital2 12.54 11.68 12.00
Tier 1 common risk-based capital (non-GAAP) 1,2 11.65 11.21 10.84
Total risk-based capital 2 15.26 14.73 15.38
Leverage capital 2 10.86 10.03 9.65
Tangible common stockholders’ equity to tangible assets (non-GAAP) 1 9.75 9.24 8.63
Adjusted efficiency ratio (non-GAAP) 1 65.50 65.42 64.42
OTHER INFORMATION
Basic Weighted-average number of common shares outstanding 1,375 1,395 1,381
Diluted Weighted-average number of common shares outstanding 1,387 1,410 1,387
Total Branch Outlets 1,666 1,705 1,711
ATMs 1,997 2,029 2,054
1 See Table 2 in Form 10-K for GAAP to non-GAAP reconciliations.
2 Current year capital ratios are estimated.
FINANCIAL HIGHLIGHTS
• The effects of problems encountered by other financial institutions that
adversely affect us or the banking industry generally could require us to
change certain business practices, reduce our revenue, impose additional
costs on us, or otherwise negatively affect our businesses.
• The effects of the failure of any component of our business infrastructure
provided by a third party could disrupt our businesses; result in the disclo-
sure of and/or misuse of confidential information or proprietary information;
increase our costs; negatively affect our reputation; and cause losses.
• Our ability to receive dividends from our subsidiaries could affect our liquidity
and ability to pay dividends to stockholders.
• Changes in accounting policies or procedures as may be required by the
Financial Accounting Standards Board or other regulatory agencies could
materially affect how we report our financial results.
• The effects of any damage to our reputation resulting from developments
related to any of the items identified above.
You should not place undue reliance on any forward-looking statements, which
speak only as of the date made. Factors or events that could cause our actual
results to differ may emerge from time to time, and it is not possible to predict all
of them. We assume no obligation to update or revise any forward-looking state-
ments that are made from time to time, either as a result of future developments,
new information or otherwise, except as may be required by law.