Regions Bank 2014 Annual Report Download - page 3
Download and view the complete annual report
Please find page 3 of the 2014 Regions Bank annual report below. You can navigate through the pages in the report by either clicking on the pages listed below, or by using the keyword search tool below to find specific information within the annual report.-
 1
1 -
 2
2 -
 3
3 -
 4
4 -
 5
5 -
 6
6 -
 7
7 -
 8
8 -
 9
9 -
 10
10 -
 11
11 -
 12
12 -
 13
13 -
 14
14 -
15
-
16
-
17
-
18
-
19
-
20
-
21
 |
 |

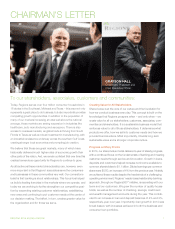
2 REGIONS 2014 ANNUAL REVIEW
Business lending constitutes more than 62% of our total loan portfolio. We
finished the year on a positive note, with more than $48 billion in business
loan balances outstanding, an increase of 5% from the previous year.
Growth in commercial and industrial lending was driven by strong perfor-
mance in our specialized lending groups, asset-based lending, as well as our
local market banking teams. Our bankers do a great job of understanding
business customers’ specialized needs and the unique characteristics of
each industry, as well as developing solutions that support our customers’
business goals.
Our consumer loan portfolio also performed well and achieved a 2% increase
over the previous year. This growth was led by our indirect auto lending and
credit card portfolios, which grew 18% and 6%, respectively. We continue
to meet more customer needs through a variety of product offerings.
In 2014, we also extended our record of prudently managing expenses. This
was the fourth consecutive year in which we reduced full-year adjusted
expenses while continuing to invest in the talent and technology necessary
to build on our momentum.
Asset quality is an essential measure of the health of a financial institution,
and in 2014, our prudent risk discipline practices again led to improvement
across our credit metrics. For example, non-accrual loans as a percentage
of total loans fell by 38 basis points to only 1.07%. Also, citing our improved
risk profile, four major credit rating agencies took positive rating actions
on Regions during the course of the year.
We are also focused on effectively deploying our capital at Regions. With
industry-leading capital levels, we can support higher payouts to share-
holders, strong organic growth and still explore strategic opportunities. In
fact, during 2014 we returned approximately $500 million to shareholders
through common share repurchases and quarterly dividends. Increasing
returns to our owners will continue to remain an important priority.
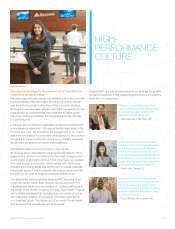
Banking on Our Customers’ Terms
Regions’ customers choose to interact with us in a variety of digital and
automated ways. Customers can use our remote deposit capture to deposit
a paycheck through Regions’ mobile app, or transfer funds to a child at college
through online banking, or visit an ATM to cash a check on a weekend.
All of these channels are highly relevant to today’s consumer. The vast
majority of our customers use multiple channels on a monthly basis, and
enabling that choice and convenience is a primary goal of our channel
strategy. Adoption of mobile and online solutions has grown rapidly, and
we expect the digital channel to continue to expand at a faster rate. This
rising demand supports our continued robust investment in digital solutions
to ensure that we are meeting customer expectations and needs.
Even as technologies evolve and the multi-channel environment expands,
we see banking fundamentally as a people business. For that reason, the
brick-and-mortar branch remains highly relevant. Our 1,666 physical points
of presence – and the associates who staff them – represent a distinct
competitive advantage. In fact, today the number one consideration for most
customers when choosing a bank is its physical location. As such, approxi-
mately 60% of our four million consumer households have visited a branch in
the last 30 days and 80% of our new account sales occur in the branch.
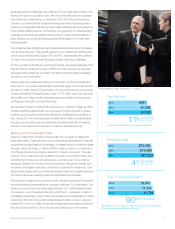
11
%Increase
* Net Income Available to Common Shareholders
($ in millions)
Net Income*
$991
$1,103
2012
2013
2014
$1,090
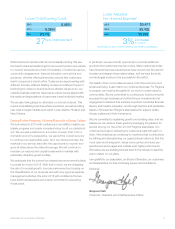
90bps Increase
1
See Table 2 in Form 10-K for GAAP to non-GAAP reconciliations.
2
Current year capital ratios are estimated.
Tier 1 Common Ratio1,2
10.8%
11.7%
2012
2013
2014
11.2%
4
%Increase
($ in millions)
Ending Loans
$73,995
$77,307
2012
2013
2014
$74,609
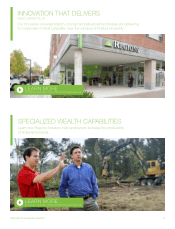
Pictured left to right: Grayson H., Cindy R.