Suzuki 2004 Annual Report Download - page 4
Download and view the complete annual report
Please find page 4 of the 2004 Suzuki annual report below. You can navigate through the pages in the report by either clicking on the pages listed below, or by using the keyword search tool below to find specific information within the annual report.-
 1
1 -
 2
2 -
 3
3 -
 4
4 -
 5
5 -
 6
6 -
 7
7 -
 8
8 -
 9
9 -
 10
10 -
 11
11 -
 12
12 -
 13
13 -
 14
14 -
 15
15 -
16
-
17
-
18
-
19
-
20
-
21
-
22
-
23
-
24
-
25
-
26
-
27
-
28
-
29
-
30
-
31
-
32
-
33
-
34
-
35
-
36
-
37
-
38
-
39
-
40
-
41
-
42
-
43
-
44
-
45
-
46
-
47
-
48
-
49
-
50
-
51
 |
 |

SUZUKI MOTOR CORPORATION
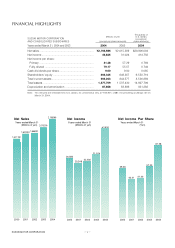
FINANCIAL HIGHLIGHTS
2001
20,248
2001
40.41
Years ended March 31
(Millions of yen)
Years ended March 31
(Millions of yen)
Years ended March 31
(Yen)
2001
1,600,253
2000
26,886
2000
55.58
2000
1,521,192
Net Sales Net Income Net Income Per Share
2002
22,392
2002
41.40
2002
1,668,251
2003
2,015,309
2003
57.29
2003
31,024
2004
2,198,986
2004
81.38
2004
43,835
3
Thousands of
Millions of yen U.S. dollars
(except per
(except per share amounts) share amounts)
Years ended March 31, 2004 and 2003
2004 2003 2004
Net sales ....................................................................... ¥2,198,986 ¥2,015,309$1$20,806,004
Net income .................................................................... 43,835 31,024 414,756
Net income per share:
Primary ....................................................................... 81.38 57.29 0.769
Fully diluted ................................................................ 79.17 55.57 0.749
Cash dividends per share............................................. 9.00 9.00 0.085
Shareholders’ equity ..................................................... 692,345 648,357 4,66,550,719
Total current assets....................................................... 902,263 844,577 8,536,889
Total assets ................................................................... 1,577,709 1,537,430 114,927,709
Depreciation and amortization ...................................... 87,858 83,896 831,282
Note: Yen amounts are translated into U.S. dollars, for convenience only, at ¥105.69 = US$1, the prevailing exchange rate on
March 31, 2004.
SUZUKI MOTOR CORPORATION
AND CONSOLIDATED SUBSIDIARIES