Suzuki 2004 Annual Report Download - page 5
Download and view the complete annual report
Please find page 5 of the 2004 Suzuki annual report below. You can navigate through the pages in the report by either clicking on the pages listed below, or by using the keyword search tool below to find specific information within the annual report.-
 1
1 -
 2
2 -
 3
3 -
 4
4 -
 5
5 -
 6
6 -
 7
7 -
 8
8 -
 9
9 -
 10
10 -
 11
11 -
 12
12 -
 13
13 -
 14
14 -
 15
15 -
 16
16 -
17
-
18
-
19
-
20
-
21
-
22
-
23
-
24
-
25
-
26
-
27
-
28
-
29
-
30
-
31
-
32
-
33
-
34
-
35
-
36
-
37
-
38
-
39
-
40
-
41
-
42
-
43
-
44
-
45
-
46
-
47
-
48
-
49
-
50
-
51
 |
 |

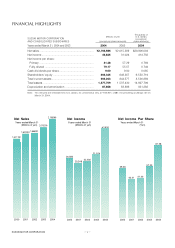
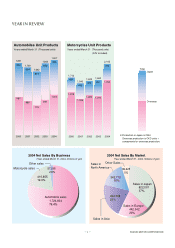
YEAR IN REVIEW
SUZUKI MOTOR CORPORATION
1,724,834
78.4%
2004 Net Sales By Business 2004 Net Sales By Market
Production in Japan is CBU.
Overseas production is CKD units +
components for overseas production.
Automobiles Unit Products
Years ended March 31 (Thousand units)
Motorcycles Unit Products
Years ended March 31 (Thousand units)
(ATV included)
Total
Japan
Overseas
(Year ended March 31, 2004, millions of yen) (Year ended March 31, 2004, millions of yen)
1,278
1,712
434
1,851
864
2000
987
1,739
854
2001
885 1,095
1,540
445
2000 2001
1,642
864
2002
778
1,223
1,625
402
2002
822,001
37%
Sales in Japan
442,342
20%
Sales in Europe
492,704
22%
Sales in Asia
342,712
16%
Sales in
North America
99,225
5%
Other Sales
57,296
2.6%
416,855
19.0%
Other sales
Automobile sales
Motorcycle sales
1,843
952
2003
891
1,927
905
2004
1,022 1,210
1,660
451
2003
1,704
2,165
460
2004
4