Tesco 2004 Annual Report Download - page 4
Download and view the complete annual report
Please find page 4 of the 2004 Tesco annual report below. You can navigate through the pages in the report by either clicking on the pages listed below, or by using the keyword search tool below to find specific information within the annual report.-
 1
1 -
 2
2 -
 3
3 -
 4
4 -
 5
5 -
 6
6 -
 7
7 -
 8
8 -
 9
9 -
 10
10 -
 11
11 -
 12
12 -
 13
13 -
 14
14 -
 15
15 -
16
-
17
-
18
-
19
-
20
-
21
-
22
-
23
-
24
-
25
-
26
-
27
-
28
-
29
-
30
-
31
-
32
-
33
-
34
-
35
-
36
-
37
-
38
-
39
-
40
-
41
-
42
-
43
-
44
-
45
-
46
-
47
-
48
-
49
-
50
-
51
-
52
-
53
-
54
-
55
-
56
-
57
-
58
-
59
-
60
 |
 |

2TESCO PLC
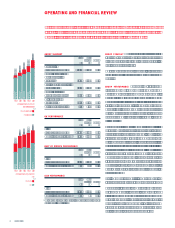
OPERATING AND FINANCIAL REVIEW
GROUP STRATEGY We have a four-part strategy for
long-term growth that we set out seven years ago:
strong UK core business; non-food growth; retailing
services and international.
Our growth has been driven by delivering a great
shopping experience for customers wherever we
operate.
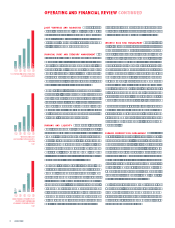
GROUP PERFORMANCE Group sales including VAT
increased by 18.7% to £33,557m (2003
£28,280m as restated) On a 52-week basis,
Group sales were up 16.7% to £32,989m. The
Group has revised its accounting policy for turnover
in line with FRS 5 Application Note G Revenue
Recognition (issued November 2003).The principal
adjustments are to report turnover net of vouchers
and on a commission-only basis for mobile phone
airtime sales.
Group underlying profit on ordinary activities
before tax (excluding net loss on disposal of Þxed
assets, integration costs and goodwill amortisation)
increased by 21.9% to £1,708m. On a 52-week
basis, Group underlying profit on ordinary activities
before tax (excluding net loss on disposal of fixed
assets, integration costs and goodwill amortisation)
increased by 20.2% to £1,684m. During the year
we purchased Kipa, a small hypermarket business
in Turkey and C Two-Network, a convenience store
operator in Japan, for £96m and £176m respectively.
The impact was to increase underlying operating
proÞt by £10m.
Profit on ordinary activities before taxation
increased by 17.6% to £1,600m (2003 £1,361m).
Group capital expenditure was £2,285m (2003
£2,134m). UK capital expenditure was £1,520m,
including £735m on new stores and £272m on
extensions and refits. Total international capital
expenditure was £765m, £322m in Asia and £443m
in Europe. In the year ahead, we forecast Group
capital expenditure to be around £2.4bn.
This operating and financial review analyses the performance of the Tesco Group
in the financial year ended 28 February 2004. It also explains other aspects of the
Groups results and operations, including strategy and risk management.
00 01 02 0403
SALES PERFORMANCE
£m (restated)
28,280
25,401
22,585
20,189
23,101
23,101
33,557
26,876
26,876
21,454
21,454
19,711
19,711
18,181
18,181
GROUP SALES
UK SALES
00 01 02 0403
CAPITAL EXPENDITURE
£m
2,134
2,027
1,944
1,488
1,228
1,228
2,285
1,520
1,520
1,276
1,276
1,206
1,206
989
989
GROUP
UK
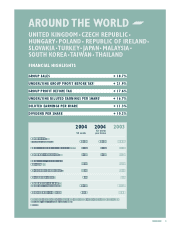
GROUP SUMMARY
2004 2003
restated Change
£m £m %
Group sales
(including value added tax) 33,557 28,280 18.7
Underlying profit on
ordinary activities
before tax1,708 1,401 21.9
Profit on ordinary activities
before taxation 1,600 1,361 17.6
Underlying diluted
earnings per share (p)16.31 13.98 16.7
Diluted earnings
per share (p) 14.93 13.42 11.3
Dividend per share (p) 6.84 6.20 10.3
UK PERFORMANCE
2004 2003
restated Change
£m £m %
Sales
(including value added tax) 26,876 23,101 16.3
Underlying operating proÞt1,526 1,297 17.7
REST OF EUROPE PERFORMANCE
2004 2003
restated Change
£m £m %
Sales
(including value added tax) 3,834 3,007 27.5
Underlying operating proÞt184 141 30.5
ASIA PERFORMANCE
2004 2003
restated Change
£m £m %
Sales
(including value added tax) 2,847 2,172 31.1
Underlying operating proÞt122 71 71.8
Excluding net loss on disposal of fixed assets, integration costs
and goodwill amortisation.