UPS 2011 Annual Report Download - page 39
Download and view the complete annual report
Please find page 39 of the 2011 UPS annual report below. You can navigate through the pages in the report by either clicking on the pages listed below, or by using the keyword search tool below to find specific information within the annual report.-
 1
1 -
2
-
3
-
4
-
5
-
6
-
7
-
8
-
9
-
10
-
11
-
12
-
13
-
14
-
15
-
16
-
17
-
18
-
19
-
20
-
21
-
22
-
23
-
24
-
25
-
26
-
27
-
28
-
 29
29 -
 30
30 -
 31
31 -
 32
32 -
 33
33 -
 34
34 -
 35
35 -
 36
36 -
 37
37 -
 38
38 -
 39
39 -
 40
40 -
 41
41 -
 42
42 -
 43
43 -
 44
44 -
 45
45 -
 46
46 -
 47
47 -
 48
48 -
 49
49 -
50
-
51
-
52
-
53
-
54
-
55
-
56
-
57
-
58
-
59
-
60
-
61
-
62
-
63
-
64
-
65
-
66
-
67
-
68
-
69
-
70
-
71
-
72
-
73
-
74
-
75
-
76
-
77
-
78
-
79
-
80
-
81
-
82
-
83
-
84
-
85
-
86
-
87
-
88
-
89
-
90
-
91
-
92
-
93
-
94
-
95
-
96
-
97
-
98
-
99
-
100
-
101
-
102
-
103
-
104
-
105
-
106
-
107
-
108
-
109
-
110
-
111
-
112
-
113
-
114
-
115
-
116
-
117
-
118
-
119
-
120
-
121
-
122
-
123
-
124
-
125
-
126
-
127
-
128
-
129
-
130
-
131
-
132
-
133
-
134
-
135
-
136
-
137
-
138
-
139
-
140
-
141
-
142
-
143
-
144
-
145
-
146
-
147
-
148
 |
 |

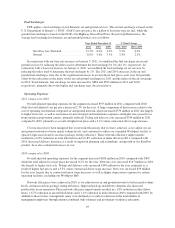
U.S. Domestic Package Operations
Year Ended December 31, % Change
2011 2010 2009 2011 / 2010 2010 / 2009
Average Daily Package Volume (in thousands):
Next Day Air .......................... 1,206 1,205 1,198 0.1% 0.6%
Deferred .............................. 975 941 957 3.6% (1.7)%
Ground ............................... 11,230 11,140 10,895 0.8% 2.2%
Total Avg. Daily Package Volume ..... 13,411 13,286 13,050 0.9% 1.8%
Average Revenue Per Piece:
Next Day Air .......................... $ 20.33 $ 19.14 $ 18.00 6.2% 6.3%
Deferred .............................. 13.32 12.50 11.81 6.6% 5.8%
Ground ............................... 7.78 7.43 7.20 4.7% 3.2%
Total Avg. Revenue Per Piece ......... $ 9.31 $ 8.85 $ 8.53 5.2% 3.8%
Operating Days in Period ......................... 254 253 253
Revenue (in millions):
Next Day Air .......................... $ 6,229 $ 5,835 $ 5,456 6.8% 6.9%
Deferred .............................. 3,299 2,975 2,859 10.9% 4.1%
Ground ............................... 22,189 20,932 19,843 6.0% 5.5%
Total Revenue ..................... $31,717 $29,742 $28,158 6.6% 5.6%
Operating Expenses (in millions):
Operating Expenses ......................... $27,953 $26,504 $26,239 5.5% 1.0%
Pension and Postretirement Benefit Plans
Mark-to-Market Charge ................ (479) (31) —
Restructuring Charge .................... — (98) —
Gains (Losses) on Real Estate Transactions . . . (15) 109 —
Aircraft Impairment Charge ............... — — (181)
Adjusted Operating Expenses ................. $27,459 $26,484 $26,058 3.7% 1.6%
Operating Profit (in millions) and Operating Margin:
Operating Profit ............................ $ 3,764 $ 3,238 $ 1,919 16.2% 68.7%
Adjusted Operating Profit .................... $ 4,258 $ 3,258 $ 2,100 30.7% 55.1%
Operating Margin ........................... 11.9% 10.9% 6.8%
Adjusted Operating Margin ................... 13.4% 11.0% 7.5%
Revenue
The change in overall revenue was impacted by the following factors for the years ended December 31,
2011 and 2010, compared with the prior years:
Volume
Rates /
Product Mix
Fuel
Surcharge
Total
Revenue
Change
Revenue Change Drivers:
2011 vs 2010 ............................ 1.3% 2.3% 3.0% 6.6%
2010 vs 2009 ............................ 1.8% 1.7% 2.1% 5.6%
Volume
2011 compared to 2010
Our overall volume increased slightly in 2011 compared with 2010, and was largely impacted by the
slowing U.S. economy during the first three quarters of the year. Business-to-consumer shipments, which
27