US Postal Service 2006 Annual Report Download - page 34
Download and view the complete annual report
Please find page 34 of the 2006 US Postal Service annual report below. You can navigate through the pages in the report by either clicking on the pages listed below, or by using the keyword search tool below to find specific information within the annual report.-
 1
1 -
2
-
3
-
4
-
5
-
6
-
7
-
8
-
9
-
10
-
11
-
12
-
13
-
14
-
15
-
16
-
17
-
18
-
19
-
20
-
21
-
22
-
23
-
 24
24 -
 25
25 -
 26
26 -
 27
27 -
 28
28 -
 29
29 -
 30
30 -
 31
31 -
 32
32 -
 33
33 -
 34
34 -
 35
35 -
 36
36 -
 37
37 -
 38
38 -
 39
39 -
 40
40 -
 41
41 -
 42
42 -
 43
43 -
 44
44 -
45
-
46
-
47
-
48
-
49
-
50
-
51
-
52
-
53
-
54
-
55
-
56
-
57
-
58
-
59
-
60
-
61
-
62
-
63
-
64
-
65
-
66
-
67
-
68
 |
 |
32 | 2006 Annual Report United States Postal Service
Productivity
We use a single indicator to measure productivity, which is called total
factor productivity (TFP). TFP measures the change in the relationship
between outputs, or workload, and all the resources used in producing
these outputs. Our main output is delivered mail, special services and
carrier service to an expanding delivery network. Our main inputs include
labor, materials, transportation and capital deployed.
During 2006, TFP improved 0.4%. This improvement is equivalent to
$255 million in expense reductions and marks our seventh consecutive
year of TFP growth, equivalent to an expense reduction of $7.0 billion
over this time. Weighted mail volume grew 0.3% and other outputs grew
by 2.8% and, when combined with 1.5% delivery point growth, yielded
an 0.8% increase in workload. We were able to achieve TFP growth by
holding increases in resources usage to a lower level than the increase in
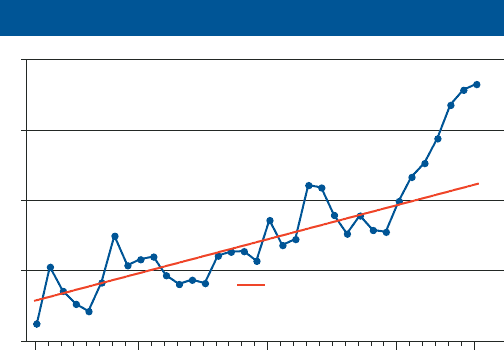
workload. The following graph shows the development of TFP since 1971.
0
5
10
15
20
20062000199019801972
Average Annual Growth 0.3% 1972 -1999
Average Annual Growth 1.5% 2000 - 2006
Total Factor Productivity Cumulative Percent Change
Capital Investments
The Board of Governors approves the budget for investments in capital
each year. The Board also approves all major capital projects, generally
defined as projects greater than $25 million. Fiscal Year 2006 began
with 44 Board-approved projects in progress, representing $6.5 billion
in approved capital. During the year, the Board approved 8 new projects
which totaled $882 million in capital. A total of 15 projects representing
$1.2 billion in approved funding were completed. Thus, the year ended
with 37 open projects amounting to $6.2 billion in approved capital.
While the funding for a project is authorized in one year, the commitment
or contract to purchase or build may occur over several years. By year
end, approximately $5.1 billion had been committed on these 37 projects.
Actual payment for these projects, or capital cash outlays, will also occur
over several years. Through the end of 2006, approximately $3.5 billion
has been paid for the 37 projects.
Of the 37 active Board-approved projects, 25 were for mail processing
equipment, 9 for facilities and 3 for other projects such as retail equip-
ment and human resources shared services.
Our total capital commitment plan for 2007 is $3.5 billion, with cash
outlays planned at $2.2 billion, of which approximately $1.5 billion are for
commitments made in prior years and the remaining $700 million for new
commitments in 2007.
Our capital plan supports future needs in developing and implementing
new automation equipment that will increase our operating efficiency.
These programs will reduce workhours in our distribution, processing and
delivery operations. Our primary focus will be on projects that generate a
high return on investment. We will continue to invest funds to maintain our
infrastructure, including facilities, vehicles and technology systems.
Our facilities program will continue to address life, health, safety and
security issues. We will invest in facilities to support our network require-
ments. We intend to maintain our infrastructure through high priority
replacement projects and ongoing repair and alteration projects.
Financing Activities
DEBT
As an “independent establishment of the executive branch of the United
States government,” we receive no tax dollars for ongoing operations. We
are self supporting, and have not received an appropriation for operational
costs since 1982. The last time we received any substantial contribution
of capital from the U.S. government was in calendar year 1977. We fund
our operations chiefly through cash generated from operations. However,
unlike companies in the private sector, we are not permitted to raise
capital through the equity markets. Consequently our only long term
source of outside capital is through borrowing. The uncertainty of the rate
setting process influences our cash management strategy.
The amount we borrow is largely determined by the difference between
our cash flow from operations, our escrow requirement, and our capital
cash outlays. Our capital cash outlays are the funds invested back into
the business for capital investments in new facilities, new automation
equipment and new services. On September 30, 2006, after placing
$2,958 million into a restricted escrow account, we borrowed $2.1 billion
to fund our capital and operational needs.
In 2005 we paid off all existing debt through cash flows created by
“savings” from P.L.108-18. This was the first time since the Postal
Reorganization Act of 1970 that we ended the year with no debt obliga-
tions outstanding.
Financial Section Part II