Windstream 2006 Annual Report Download - page 129
Download and view the complete annual report
Please find page 129 of the 2006 Windstream annual report below. You can navigate through the pages in the report by either clicking on the pages listed below, or by using the keyword search tool below to find specific information within the annual report.-
 1
1 -
2
-
3
-
4
-
5
-
6
-
7
-
8
-
9
-
10
-
11
-
12
-
13
-
14
-
15
-
16
-
17
-
18
-
19
-
20
-
21
-
22
-
23
-
24
-
25
-
26
-
27
-
28
-
29
-
30
-
31
-
32
-
33
-
34
-
35
-
36
-
37
-
38
-
39
-
40
-
41
-
42
-
43
-
44
-
45
-
46
-
47
-
48
-
49
-
50
-
51
-
52
-
53
-
54
-
55
-
56
-
57
-
58
-
59
-
60
-
61
-
62
-
63
-
64
-
65
-
66
-
67
-
68
-
69
-
70
-
71
-
72
-
73
-
74
-
75
-
76
-
77
-
78
-
79
-
80
-
81
-
82
-
83
-
84
-
85
-
86
-
87
-
88
-
89
-
90
-
91
-
92
-
93
-
94
-
95
-
96
-
97
-
98
-
99
-
100
-
101
-
102
-
103
-
104
-
105
-
106
-
107
-
108
-
109
-
110
-
111
-
112
-
113
-
114
-
115
-
116
-
117
-
118
-
 119
119 -
 120
120 -
 121
121 -
 122
122 -
 123
123 -
 124
124 -
 125
125 -
 126
126 -
 127
127 -
 128
128 -
 129
129 -
 130
130 -
 131
131 -
 132
132 -
 133
133 -
 134
134 -
 135
135 -
 136
136 -
 137
137 -
 138
138 -
 139
139 -
140
-
141
-
142
-
143
-
144
-
145
-
146
-
147
-
148
-
149
-
150
-
151
-
152
-
153
-
154
-
155
-
156
-
157
-
158
-
159
-
160
-
161
-
162
-
163
-
164
-
165
-
166
-
167
-
168
-
169
-
170
-
171
-
172
-
173
-
174
-
175
-
176
-
177
-
178
-
179
-
180
-
181
-
182
 |
 |

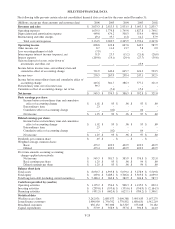
SELECTED FINANCIAL DATA
The following table presents certain selected consolidated financial data as of and for the years ended December 31:
(Millions, except per share amounts and customer data) 2006 2005 2004 2003 2002
Revenues and sales $ 3,033.3 $ 2,923.5 $ 2,933.5 $ 3,003.3 $ 2,835.7
Operating expenses 1,635.5 1,779.8 1,745.6 1,827.8 1,740.1
Depreciation and amortization expense 449.6 474.2 508.5 519.4 469.8
Restructuring and other charges 49.4 35.7 11.8 12.2 37.9
Total costs and expenses 2,134.5 2,289.7 2,265.9 2,359.4 2,247.8
Operating income 898.8 633.8 667.6 643.9 587.9
Other income, net 8.7 11.6 13.7 5.8 2.0
Loss on extinguishment of debt (7.9) ----
Intercompany interest income (expense), net 31.9 23.3 (15.2) (21.6) (26.8)
Interest expense (209.6) (19.1) (20.4) (27.7) (39.6)
Gain on disposal of assets, write-down of
investments and other, net - - - 23.9 -
Income before income taxes, extraordinary item and
cumulative effect of accounting change 721.9 649.6 645.7 624.3 523.5
Income taxes 276.3 267.9 259.4 247.1 202.5
Income before extraordinary item and cumulative effect of
accounting change 445.6 381.7 386.3 377.2 321.0
Extraordinary item, net of income taxes 99.7 ----
Cumulative effect of accounting change, net of tax - (7.4) - 15.6 -
Net income $ 545.3 $ 374.3 $ 386.3 $ 392.8 $ 321.0
Basic earnings per share:
Income before extraordinary item and cumulative
effect of accounting change $ 1.02 $ .95 $ .96 $ .93 $ .80
Extraordinary item .23 ----
Cumulative effect of accounting change - (.02) - .04 -
Net income $ 1.25 $ .93 $ .96 $ .97 $ .80
Diluted earnings per share:
Income before extraordinary item and cumulative
effect of accounting change $ 1.02 $ .95 $ .96 $ .93 $ .80
Extraordinary item .23 ----
Cumulative effect of accounting change - (.02) - .04 -
Net income $ 1.25 $ .93 $ .96 $ .97 $ .80
Dividends per common share $ .45 $ - $ - $ - $ -
Weighted average common shares:
Basic 435.2 402.9 402.9 402.9 402.9
Diluted 435.4 402.9 402.9 402.9 402.9
Pro forma amounts assuming accounting
changes applied retroactively:
Net income $ 545.3 $ 381.7 $ 385.9 $ 376.8 $ 321.8
Basic earnings per share $ 1.25 $ .95 $ .96 $ .94 $ .80
Diluted earnings per share $ 1.25 $ .95 $ .96 $ .94 $ .80
Balance sheet data
Total assets $ 8,030.7 $ 4,935.8 $ 5,079.2 $ 5,276.9 $ 5,519.8
Total equity $ 469.8 $ 3,489.2 $ 3,706.8 $ 3,925.6 $ 4,039.0
Total long-term debt (including current maturities) $ 5,488.4 $ 260.8 $ 282.9 $ 304.8 $ 587.3
Cash flows provided by (used in)
Operating activities $ 1,125.2 $ 954.6 $ 968.3 $ 1,135.0 $ 822.4
Investing activities $ (299.0) $ (353.6) $ (335.6) $ (356.9) $ (2,164.3)
Financing activities $ (451.3) $ (602.4) $ (627.1) $ (784.2) $ 1,340.1
Statistical data
Wireline access lines 3,242,931 2,885,673 3,009,388 3,095,635 3,167,275
Long distance customers 1,990,950 1,750,762 1,770,852 1,680,181 1,542,210
Broadband customers 656,132 397,696 243,325 153,028 70,182
Capital expenditures $ 373.9 $ 356.9 $ 337.8 $ 390.8 $ 414.0
F-28