Windstream 2006 Annual Report Download - page 171
Download and view the complete annual report
Please find page 171 of the 2006 Windstream annual report below. You can navigate through the pages in the report by either clicking on the pages listed below, or by using the keyword search tool below to find specific information within the annual report.-
 1
1 -
2
-
3
-
4
-
5
-
6
-
7
-
8
-
9
-
10
-
11
-
12
-
13
-
14
-
15
-
16
-
17
-
18
-
19
-
20
-
21
-
22
-
23
-
24
-
25
-
26
-
27
-
28
-
29
-
30
-
31
-
32
-
33
-
34
-
35
-
36
-
37
-
38
-
39
-
40
-
41
-
42
-
43
-
44
-
45
-
46
-
47
-
48
-
49
-
50
-
51
-
52
-
53
-
54
-
55
-
56
-
57
-
58
-
59
-
60
-
61
-
62
-
63
-
64
-
65
-
66
-
67
-
68
-
69
-
70
-
71
-
72
-
73
-
74
-
75
-
76
-
77
-
78
-
79
-
80
-
81
-
82
-
83
-
84
-
85
-
86
-
87
-
88
-
89
-
90
-
91
-
92
-
93
-
94
-
95
-
96
-
97
-
98
-
99
-
100
-
101
-
102
-
103
-
104
-
105
-
106
-
107
-
108
-
109
-
110
-
111
-
112
-
113
-
114
-
115
-
116
-
117
-
118
-
119
-
120
-
121
-
122
-
123
-
124
-
125
-
126
-
127
-
128
-
129
-
130
-
131
-
132
-
133
-
134
-
135
-
136
-
137
-
138
-
139
-
140
-
141
-
142
-
143
-
144
-
145
-
146
-
147
-
148
-
149
-
150
-
151
-
152
-
153
-
154
-
155
-
156
-
157
-
158
-
159
-
160
-
 161
161 -
 162
162 -
 163
163 -
 164
164 -
 165
165 -
 166
166 -
 167
167 -
 168
168 -
 169
169 -
 170
170 -
 171
171 -
 172
172 -
 173
173 -
 174
174 -
 175
175 -
 176
176 -
 177
177 -
 178
178 -
 179
179 -
 180
180 -
 181
181 -
182
 |
 |

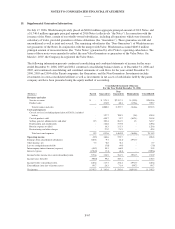
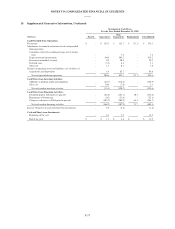
NOTES TO CONSOLIDATED FINANCIAL STATEMENTS
15. Supplemental Guarantor Information, Continued:
Consolidated Balance Sheet
As of December 31, 2006
(Millions) Parent Guarantors
Non-
Guarantors Eliminations Consolidated
ASSETS
Current Assets
Cash and short-term investments $ 362.4 $ 0.6 $ 23.8 $ - $ 386.8
Accounts receivable (less allowance for doubtful
accounts of $10.4) 0.9 110.0 226.3 - 337.2
Inventories - 28.7 14.8 - 43.5
Prepaid expenses and other 10.0 3.1 16.1 - 29.2
Assets held for sale - 80.0 - - 80.0
Total current assets 373.3 222.4 281.0 - 876.7
Investments 5,781.8 62.1 6.7 (5,842.9) 7.7
Goodwill and other intangibles - 1,560.6 1,504.8 - 3,065.4
Net property, plant and equipment 7.6 1,201.3 2,730.9 - 3,939.8
Other assets 41.4 7.1 92.6 - 141.1
Total Assets $ 6,204.1 $ 3,053.5 $ 4,616.0 $ (5,842.9) $ 8,030.7
LIABILITIES AND SHAREHOLDERS’ EQUITY
Current Liabilities
Current maturities of long-term debt $ 22.0 $ 0.2 $ 10.0 $ - $ 32.2
Accounts payable 10.6 35.9 123.0 - 169.5
Affiliates payable 167.9 1,025.6 (1,193.5) - -
Advance payments and customer deposits - 14.5 68.3 - 82.8
Accrued dividends 119.2 - - - 119.2
Accrued taxes (84.3) 56.6 59.6 - 31.9
Accrued interest 145.8 1.7 0.7 - 148.2
Other current liabilities 13.6 16.3 38.5 - 68.4
Liabilities related to assets held for sale - 32.4 - - 32.4
Total current liabilities 394.8 1,183.2 (893.4) - 684.6
Long-term debt 5,296.5 100.1 59.6 - 5,456.2
Deferred income taxes (20.2) 388.8 622.2 - 990.8
Other liabilities 63.2 37.3 328.8 - 429.3
Total liabilities 5,734.3 1,709.4 117.2 - 7,560.9
Commitments and Contingencies (See Note 13)
Shareholders’ Equity:
Common stock - (0.4) 25.9 (25.5) -
Additional paid-in capital 550.5 1,153.0 2,626.6 (3,779.6) 550.5
Accumulated other comprehensive income (loss) (150.8) - (127.2) 127.2 (150.8)
Retained earnings 70.1 191.5 1,973.5 (2,165.0) 70.1
Total shareholders’ equity 469.8 1,344.1 4,498.8 (5,842.9) 469.8
Total Liabilities and Shareholders’ Equity $ 6,204.1 $ 3,053.5 $ 4,616.0 $ (5,842.9) $ 8,030.7
F-70