Windstream 2006 Annual Report Download - page 163
Download and view the complete annual report
Please find page 163 of the 2006 Windstream annual report below. You can navigate through the pages in the report by either clicking on the pages listed below, or by using the keyword search tool below to find specific information within the annual report.-
 1
1 -
2
-
3
-
4
-
5
-
6
-
7
-
8
-
9
-
10
-
11
-
12
-
13
-
14
-
15
-
16
-
17
-
18
-
19
-
20
-
21
-
22
-
23
-
24
-
25
-
26
-
27
-
28
-
29
-
30
-
31
-
32
-
33
-
34
-
35
-
36
-
37
-
38
-
39
-
40
-
41
-
42
-
43
-
44
-
45
-
46
-
47
-
48
-
49
-
50
-
51
-
52
-
53
-
54
-
55
-
56
-
57
-
58
-
59
-
60
-
61
-
62
-
63
-
64
-
65
-
66
-
67
-
68
-
69
-
70
-
71
-
72
-
73
-
74
-
75
-
76
-
77
-
78
-
79
-
80
-
81
-
82
-
83
-
84
-
85
-
86
-
87
-
88
-
89
-
90
-
91
-
92
-
93
-
94
-
95
-
96
-
97
-
98
-
99
-
100
-
101
-
102
-
103
-
104
-
105
-
106
-
107
-
108
-
109
-
110
-
111
-
112
-
113
-
114
-
115
-
116
-
117
-
118
-
119
-
120
-
121
-
122
-
123
-
124
-
125
-
126
-
127
-
128
-
129
-
130
-
131
-
132
-
133
-
134
-
135
-
136
-
137
-
138
-
139
-
140
-
141
-
142
-
143
-
144
-
145
-
146
-
147
-
148
-
149
-
150
-
151
-
152
-
 153
153 -
 154
154 -
 155
155 -
 156
156 -
 157
157 -
 158
158 -
 159
159 -
 160
160 -
 161
161 -
 162
162 -
 163
163 -
 164
164 -
 165
165 -
 166
166 -
 167
167 -
 168
168 -
 169
169 -
 170
170 -
 171
171 -
 172
172 -
 173
173 -
174
-
175
-
176
-
177
-
178
-
179
-
180
-
181
-
182
 |
 |

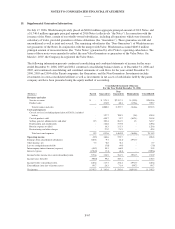
NOTES TO CONSOLIDATED FINANCIAL STATEMENTS
12. Income Taxes:
Income tax expense was as follows for the years ended December 31:
(Millions) 2006 2005 2004
Current:
Federal $172.7 $215.5 $155.0
State and other 10.4 55.9 37.2
183.1 271.4 192.2
Deferred:
Federal 63.0 11.5 57.1
State and other 30.2 (15.0) 10.1
93.2 (3.5) 67.2
$276.3 $267.9 $259.4
Deferred income tax expense for all three years primarily resulted from temporary differences between
depreciation expense for income tax purposes and depreciation expense recorded in the consolidated financial
statements. Deferred income tax expense for all periods also included the effects of amortizing indefinite-lived
intangible assets for income tax purposes. Those assets are not amortized for financial statement purposes in
accordance with SFAS No. 142.
Differences between the federal income tax statutory rates and effective income tax rates, which include both
federal and state income taxes, were as follows for the years ended December 31:
2006 2005 2004
Statutory federal income tax rates 35.0% 35.0% 35.0%
Increase (decrease):
State income taxes, net of federal benefit 3.7 4.1 4.8
Reversal of income tax contingency reserves (0.5) - -
Costs associated with spin off of Company 0.7 1.7 -
Other items, net (0.6) 0.5 0.4
Effective income tax rates 38.3% 41.3% 40.2%
The significant components of the net deferred income tax liability (asset) were as follows at December 31:
(Millions) 2006 2005
Property, plant and equipment $ 728.9 $509.1
Goodwill and other intangible assets 500.5 160.6
Operating loss carryforward (107.1) -
Postretirement and other employee benefits (80.8) (21.4)
Unrealized holding loss on interest swaps (15.1) -
Deferred compensation (11.8) -
Deferred debt costs (9.0) -
Other, net (25.4) 17.4
980.2 $665.7
Valuation allowance 10.6 -
Deferred income taxes, net $ 990.8 $665.7
Current deferred tax assets $ - $ (10.6)
Noncurrent deferred income tax liabilities 990.8 676.3
Deferred income taxes, net $ 990.8 $665.7
At December 31, 2006 and 2005, total deferred tax assets were $294.4 million and $36.3 million, respectively,
and total deferred tax liabilities were $1,285.2 million and $702.0 million, respectively.
F-62