eBay 2007 Annual Report Download - page 64
Download and view the complete annual report
Please find page 64 of the 2007 eBay annual report below. You can navigate through the pages in the report by either clicking on the pages listed below, or by using the keyword search tool below to find specific information within the annual report.-
 1
1 -
2
-
3
-
4
-
5
-
6
-
7
-
8
-
9
-
10
-
11
-
12
-
13
-
14
-
15
-
16
-
17
-
18
-
19
-
20
-
21
-
22
-
23
-
24
-
25
-
26
-
27
-
28
-
29
-
30
-
31
-
32
-
33
-
34
-
35
-
36
-
37
-
38
-
39
-
40
-
41
-
42
-
43
-
44
-
45
-
46
-
47
-
48
-
49
-
50
-
51
-
52
-
53
-
 54
54 -
 55
55 -
 56
56 -
 57
57 -
 58
58 -
 59
59 -
 60
60 -
 61
61 -
 62
62 -
 63
63 -
 64
64 -
 65
65 -
 66
66 -
 67
67 -
 68
68 -
 69
69 -
 70
70 -
 71
71 -
 72
72 -
 73
73 -
 74
74 -
75
-
76
-
77
-
78
-
79
-
80
-
81
-
82
-
83
-
84
-
85
-
86
-
87
-
88
-
89
-
90
-
91
-
92
-
93
-
94
-
95
-
96
-
97
-
98
-
99
-
100
-
101
-
102
-
103
-
104
-
105
-
106
-
107
-
108
-
109
-
110
-
111
-
112
-
113
-
114
-
115
-
116
-
117
-
118
-
119
-
120
-
121
-
122
-
123
-
124
-
125
-
126
-
127
-
128
 |
 |

Summary of Cost of Net Revenues, Operating Expenses, Non-Operating Items and Provision for
Income Taxes
The following table summarizes changes in cost of net revenues, operating expenses, non-operating items and
provision for income taxes (note that 2007 and 2006 amounts reflect our adoption of the modified prospective
method under FAS 123(R)):
2005 2006 2007 in Dollars in % in Dollars in %
Year Ended December 31,
Change from
2005 to 2006
Change from
2006 to 2007
(in thousands, except percentages)
Cost of net revenues .......... $ 818,104 $1,256,792 $1,762,972 $438,688 54% 506,180 40%
Sales and marketing .......... 1,185,929 1,619,857 1,925,393 433,928 37% 305,536 19%
Product development .......... 328,191 494,695 619,727 166,504 51% 125,032 25%
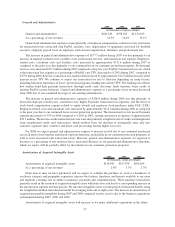
General and administrative ..... 649,529 978,363 1,156,015 328,834 51% 177,652 18%
Amortization of acquired
intangible assets ........... 128,941 197,078 204,104 68,137 53% 7,026 4%
Impairment of goodwill........ — — 1,390,938 — — 1,390,938 100%
Interest and other income, net . . . 111,099 130,017 154,271 18,918 17% 24,254 19%
Interest expense ............. 3,478 5,916 16,600 2,438 70% 10,684 181%
Provision for income taxes ..... 467,285 421,418 402,600 (45,867) (10)% (18,818) (4%)
As of January 1, 2006, we began accounting for stock-based compensation under FAS 123(R), which requires
the recognition of the fair value of stock-based compensation. We adopted FAS 123(R) using the modified
prospective method, which requires the application of the accounting standard as of January 1, 2006. In accordance
with the modified prospective method, the consolidated financial statements for 2005 have not been restated to
reflect, and do not include, the impact of FAS 123(R). Stock-based compensation expense related to equity awards
and employee stock purchases for 2005, 2006 and 2007 was allocated as follows (in thousands):
2005 2006 2007
Cost of net revenues ................................. $ 1,881 $ 32,981 $ 37,009
Salesandmarketing................................. 8,696 96,547 81,299
Product development................................. 6,468 81,489 76,002
General and administrative ............................ 14,727 106,393 107,503
Total stock-based compensation expense .................. 31,772 317,410 301,813
Tax benefit ........................................ (13,023) (97,572) (92,726)
Stock-based compensation expense, net of tax .............. $18,749 $219,838 $209,087
As of December 31, 2007, there was approximately $541.0 million of total unrecognized compensation cost,
excluding tax benefits, related to stock-based incentive awards granted under our equity incentive plans. That cost is
expected to be recognized over a weighted-average period of three years.
We continue to believe that employee stock-based incentive plans represent an appropriate and essential
component of our overall compensation program. We grant stock-based awards to substantially all employees and
believe that this broad-based program helps us to attract, motivate, and retain high quality employees, to the
ultimate benefit of our stockholders. We granted restricted stock units as part of our annual employee incentive
compensation program for the first time in 2007. Stock options, restricted stock units and restricted stock awards
granted during the years ended December 31, 2007 and 2006, net of cancellations/forfeitures, represented
approximately 1% and 2% of our total common stock outstanding as of December 31, 2007 and 2006, respectively.
A substantial portion of our stock-based awards granted during 2007 were granted to existing employees.
54