eBay 2007 Annual Report Download - page 69
Download and view the complete annual report
Please find page 69 of the 2007 eBay annual report below. You can navigate through the pages in the report by either clicking on the pages listed below, or by using the keyword search tool below to find specific information within the annual report.-
 1
1 -
2
-
3
-
4
-
5
-
6
-
7
-
8
-
9
-
10
-
11
-
12
-
13
-
14
-
15
-
16
-
17
-
18
-
19
-
20
-
21
-
22
-
23
-
24
-
25
-
26
-
27
-
28
-
29
-
30
-
31
-
32
-
33
-
34
-
35
-
36
-
37
-
38
-
39
-
40
-
41
-
42
-
43
-
44
-
45
-
46
-
47
-
48
-
49
-
50
-
51
-
52
-
53
-
54
-
55
-
56
-
57
-
58
-
 59
59 -
 60
60 -
 61
61 -
 62
62 -
 63
63 -
 64
64 -
 65
65 -
 66
66 -
 67
67 -
 68
68 -
 69
69 -
 70
70 -
 71
71 -
 72
72 -
 73
73 -
 74
74 -
 75
75 -
 76
76 -
 77
77 -
 78
78 -
 79
79 -
80
-
81
-
82
-
83
-
84
-
85
-
86
-
87
-
88
-
89
-
90
-
91
-
92
-
93
-
94
-
95
-
96
-
97
-
98
-
99
-
100
-
101
-
102
-
103
-
104
-
105
-
106
-
107
-
108
-
109
-
110
-
111
-
112
-
113
-
114
-
115
-
116
-
117
-
118
-
119
-
120
-
121
-
122
-
123
-
124
-
125
-
126
-
127
-
128
 |
 |

impacted by our decision to access the available credit under our credit agreement. See additional discussion of our
credit agreement in “Note 8 — Commitments and Contingencies” to our consolidated financial statements included
elsewhere in this Annual Report on Form 10-K.
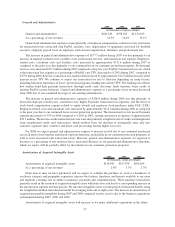
Provision for Income Taxes
2005 2006 2007
(In thousands, except percentages)
Provision for income taxes ............................ $467,285 $421,418 $402,600
As a percentage of net revenues ........................ 10.3% 7.1% 5.2%
Effective tax rate ................................... 30% 27% 54%
The provision for income taxes differs from the amount computed by applying the statutory U.S. federal rate
principally due to foreign income with lower tax rates and from tax credits that lower the effective tax rate, offset by
state taxes, subsidiary losses and an impairment charge for which we have not provided a benefit and other factors
that impact the effective tax rate.
Our effective tax rate in 2007 was 54%, compared to 27% in 2006. The increase was due to the goodwill
impairment charge with respect to our Communications reporting unit which is non-deductible for tax purposes,
partially offset by a tax benefit from a ruling issued by a tax authority related to prior periods. The lower effective
tax rates in 2006 as compared to 2005 resulted primarily from the expansion of our international businesses and
from changes in our operations in international markets. We expect our effective tax rate for 2008 to be significantly
lower than in 2007.
Liquidity and Capital Resources
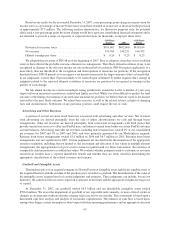
Cash Flows
2005 2006 2007
Year Ended December 31,
(in thousands)
Consolidated Cash Flow Data:
Net cash provided by (used in):
Operating activities ............................ $2,009,891 $ 2,247,791 $2,641,109
Investing activities ............................. (2,452,731) 228,853 (693,146)
Financing activities ............................ 471,606 (1,260,687) (693,392)
Effect of exchange rates on cash and cash equivalents . . (45,231) 133,255 303,828
Net (decrease) increase in cash and cash equivalents.... $ (16,465) $ 1,349,212 $1,558,399
We have generated cash from operating activities in amounts greater than net income in 2007, 2006 and 2005,
due primarily to non-cash charges to earnings and tax benefits from stock-based compensation. Non-cash charges to
earnings included depreciation and amortization on our long-term assets, stock-based compensation, provision for
doubtful accounts and authorized credits resulting from increasing revenues and the provision for transaction losses
resulting from increased net TPV processed by PayPal. Non-cash charges in 2007 also included a $1.4 billion
goodwill impairment charge, whereas there was no impairment charge in the prior years. We expect net cash
provided by operating activities to increase due primarily to higher net income.
Cash paid for income taxes in 2007, 2006 and 2005 was $363.0 million, $179.2 million and $40.3 million,
respectively, as a substantial portion of our net operating losses and tax credits were utilized in 2005. Beginning in
2006, we were required to make cash payments for U.S. taxes.
Prior to adopting FAS 123(R), we presented all tax benefits resulting from the exercise of equity awards as
operating cash flows in the consolidated statement of cash flows. FAS 123(R) requires cash flows resulting from
excess tax benefits to be classified as a part of cash flows from financing activities. Excess tax benefits represent tax
benefits related to exercised options in excess of the associated deferred tax asset for such options. As a result of
59