Big Lots 2013 Annual Report Download - page 171
Download and view the complete annual report
Please find page 171 of the 2013 Big Lots annual report below. You can navigate through the pages in the report by either clicking on the pages listed below, or by using the keyword search tool below to find specific information within the annual report.-
 1
1 -
2
-
3
-
4
-
5
-
6
-
7
-
8
-
9
-
10
-
11
-
12
-
13
-
14
-
15
-
16
-
17
-
18
-
19
-
20
-
21
-
22
-
23
-
24
-
25
-
26
-
27
-
28
-
29
-
30
-
31
-
32
-
33
-
34
-
35
-
36
-
37
-
38
-
39
-
40
-
41
-
42
-
43
-
44
-
45
-
46
-
47
-
48
-
49
-
50
-
51
-
52
-
53
-
54
-
55
-
56
-
57
-
58
-
59
-
60
-
61
-
62
-
63
-
64
-
65
-
66
-
67
-
68
-
69
-
70
-
71
-
72
-
73
-
74
-
75
-
76
-
77
-
78
-
79
-
80
-
81
-
82
-
83
-
84
-
85
-
86
-
87
-
88
-
89
-
90
-
91
-
92
-
93
-
94
-
95
-
96
-
97
-
98
-
99
-
100
-
101
-
102
-
103
-
104
-
105
-
106
-
107
-
108
-
109
-
110
-
111
-
112
-
113
-
114
-
115
-
116
-
117
-
118
-
119
-
120
-
121
-
122
-
123
-
124
-
125
-
126
-
127
-
128
-
129
-
130
-
131
-
132
-
133
-
134
-
135
-
136
-
137
-
138
-
139
-
140
-
141
-
142
-
143
-
144
-
145
-
146
-
147
-
148
-
149
-
150
-
151
-
152
-
153
-
154
-
155
-
156
-
157
-
158
-
159
-
160
-
 161
161 -
 162
162 -
 163
163 -
 164
164 -
 165
165 -
 166
166 -
 167
167 -
 168
168 -
 169
169 -
 170
170 -
 171
171 -
 172
172 -
 173
173 -
 174
174 -
 175
175 -
 176
176 -
 177
177 -
 178
178 -
 179
179 -
 180
180 -
 181
181 -
182
-
183
-
184
-
185
-
186
-
187
-
188
-
189
-
190
-
191
-
192
-
193
-
194
-
195
-
196
-
197
-
198
-
199
-
200
-
201
-
202
-
203
-
204
-
205
-
206
-
207
-
208
-
209
-
210
-
211
-
212
-
213
-
214
-
215
-
216
-
217
-
218
-
219
-
220
-
221
-
222
-
223
-
224
-
225
-
226
-
227
-
228
-
229
-
230
-
231
-
232
-
233
-
234
-
235
-
236
-
237
-
238
 |
 |

29
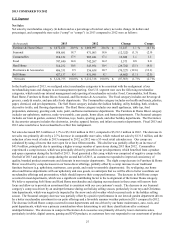
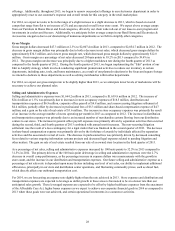
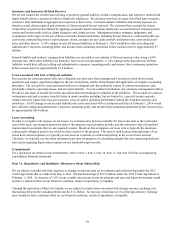
Depreciation Expense
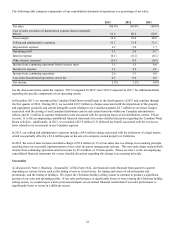
Depreciation expense increased $10.1 million to $113.2 million in 2013 compared to $103.1 million in 2012. The increase is
directly related to our new store openings in both 2013 and late 2012, investments in systems, and capital spending to support
and maintain our stores and distribution centers. Depreciation expense as a percentage of net sales increased by 20 basis points
compared to 2012.
For 2014, we expect capital expenditures of approximately $115 million to $120 million, which includes maintenance capital
for our stores, distributions centers, and corporate offices, the construction and opening of 30 new stores and investing in
coolers, freezers and e-commerce technologies. Using this assumption and the run rate of depreciation on our existing property
and equipment, we expect 2014 depreciation expense to be approximately $120 million, which would represent an increase
from the $113.2 million of depreciation expense in 2013.
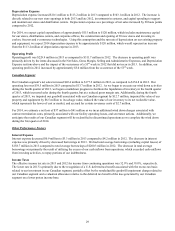
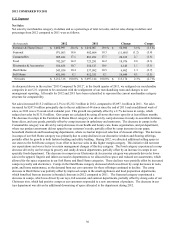
Operating Profit
Operating profit was $229.9 million in 2013 as compared to $311.7 million in 2012. The decrease in operating profit was
primarily driven by the items discussed in the Net Sales, Gross Margin, Selling and Administrative Expenses, and Depreciation
Expense sections above and the impact of the occurrence of a 53rd week in 2012 that did not recur in 2013. In addition, our
operating profit in 2012 increased by approximately $5.0 million from the occurrence of the 53rd week.
Canadian Segment
Our Canadian segment’s net sales increased $22.4 million to $177.2 million in 2013, as compared to $154.8 in 2012. Our
operating loss was $39.5 million in 2013 compared to $13.7 million in 2012. As we began to execute our wind down activities
during the fourth quarter of 2013, we began a markdown program to facilitate the liquidation of inventory in the fourth quarter
of 2013, which increased sales during the fourth quarter, but at a reduced gross margin rate. Additionally, during the fourth
quarter of 2013, we impaired our goodwill associated with our Canadian segment by $12.7 million, impaired the value of our
property and equipment by $6.5 million to its salvage value, reduced the value of our inventory to its net realizable value,
which represents the lower of cost or market, and accrued for certain severance costs of $2.7 million.
For 2014, we estimate a net loss of $37 million to $41 million as we incur additional wind down charges associated with
contract termination costs, primarily associated with our facility operating leases, and severance actions. Additionally, we
anticipate the results of our Canadian segment will be reclassified to discontinued operations as we complete the wind down
during the first quarter of 2014.
Other Performance Factors
Interest Expense
Interest expense decreased $0.9 million to $3.3 million in 2013 compared to $4.2 million in 2012. The decrease in interest
expense was primarily driven by decreased borrowings in 2013. We had total average borrowings (including capital leases) of
$158.7 million in 2013 compared to total average borrowings of $200.3 million in 2012. The decrease in total average
borrowings was primarily the result of utilizing the excess of our cash inflows from operations, which exceeded cash outflows
from investing activities, to repay portions of our indebtedness.
Income Taxes
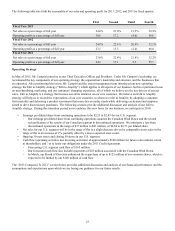
The effective income tax rate in 2013 and 2012 for income from continuing operations was 32.9% and 39.8%, respectively.
The lower rate in 2013 is primarily due to the recognition of a U.S. deferred tax benefit associated with the excess tax basis
related to our investment in our Canadian segment, partially offset by the nondeductible goodwill impairment charge related to
our Canadian segment and a valuation allowance relative to the deferred tax benefit of the loss generated by our Canadian
segment on a lower pretax income base.