Big Lots 2013 Annual Report Download - page 208
Download and view the complete annual report
Please find page 208 of the 2013 Big Lots annual report below. You can navigate through the pages in the report by either clicking on the pages listed below, or by using the keyword search tool below to find specific information within the annual report.-
 1
1 -
2
-
3
-
4
-
5
-
6
-
7
-
8
-
9
-
10
-
11
-
12
-
13
-
14
-
15
-
16
-
17
-
18
-
19
-
20
-
21
-
22
-
23
-
24
-
25
-
26
-
27
-
28
-
29
-
30
-
31
-
32
-
33
-
34
-
35
-
36
-
37
-
38
-
39
-
40
-
41
-
42
-
43
-
44
-
45
-
46
-
47
-
48
-
49
-
50
-
51
-
52
-
53
-
54
-
55
-
56
-
57
-
58
-
59
-
60
-
61
-
62
-
63
-
64
-
65
-
66
-
67
-
68
-
69
-
70
-
71
-
72
-
73
-
74
-
75
-
76
-
77
-
78
-
79
-
80
-
81
-
82
-
83
-
84
-
85
-
86
-
87
-
88
-
89
-
90
-
91
-
92
-
93
-
94
-
95
-
96
-
97
-
98
-
99
-
100
-
101
-
102
-
103
-
104
-
105
-
106
-
107
-
108
-
109
-
110
-
111
-
112
-
113
-
114
-
115
-
116
-
117
-
118
-
119
-
120
-
121
-
122
-
123
-
124
-
125
-
126
-
127
-
128
-
129
-
130
-
131
-
132
-
133
-
134
-
135
-
136
-
137
-
138
-
139
-
140
-
141
-
142
-
143
-
144
-
145
-
146
-
147
-
148
-
149
-
150
-
151
-
152
-
153
-
154
-
155
-
156
-
157
-
158
-
159
-
160
-
161
-
162
-
163
-
164
-
165
-
166
-
167
-
168
-
169
-
170
-
171
-
172
-
173
-
174
-
175
-
176
-
177
-
178
-
179
-
180
-
181
-
182
-
183
-
184
-
185
-
186
-
187
-
188
-
189
-
190
-
191
-
192
-
193
-
194
-
195
-
196
-
197
-
 198
198 -
 199
199 -
 200
200 -
 201
201 -
 202
202 -
 203
203 -
 204
204 -
 205
205 -
 206
206 -
 207
207 -
 208
208 -
 209
209 -
 210
210 -
 211
211 -
 212
212 -
 213
213 -
 214
214 -
 215
215 -
 216
216 -
 217
217 -
 218
218 -
219
-
220
-
221
-
222
-
223
-
224
-
225
-
226
-
227
-
228
-
229
-
230
-
231
-
232
-
233
-
234
-
235
-
236
-
237
-
238
 |
 |
66
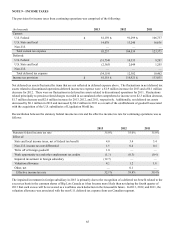
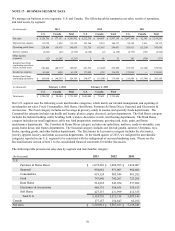
Income tax payments and refunds were as follows:
(In thousands) 2013 2012 2011
Income taxes paid $122,672 $95,596 $ 114,406
Income taxes refunded (551)(2,764)(983)
N
et income taxes pai
d
$122,121 $92,832 $ 113,423
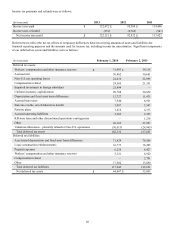
Deferred taxes reflect the net tax effects of temporary differences between carrying amounts of assets and liabilities for
financial reporting purposes and the amounts used for income tax, including income tax uncertainties. Significant components
of our deferred tax assets and liabilities were as follows:
(In thousands) February 1, 2014 February 2, 2013
Deferred tax assets:
Workers’ compensation and other insurance reserves $31,483 $34,118
Accrued rent 30,962 30,681
Non-U.S. net operating losses 24,430 22,098
Compensation related 24,505 21,351
Impaired investment in foreign subsidiary 23,899
—
Uniform inventory capitalization 20,708 20,654
Depreciation and fixed asset basis differences 12,727 11,475
Accrued state taxes 7,540 6,931
State tax credits, net of federal tax benefit 3,987 3,547
Pension plans 3,414 4,315
Accrued operating liabilities 2,585 2,325
KB store lease and other discontinued operations contingencies
—
1,218
Other 26,105 23,907
Valuation allowances - primarily related to Non-U.S. operations (30,013)(24,965)
Total deferred tax assets 182,332 157,655
Deferred tax liabilities:
Accelerated depreciation and fixed asset basis differences 71,829 76,509
Lease construction reimbursements 16,773 16,203
Prepaid expenses 6,220 6,427
Workers’ compensation and other insurance reserves 5,121 6,922
Compensation related
—
2,701
Other 17,502 13,890
Total deferred tax liabilities 117,445 122,652
Net deferred tax assets $64,887 $35,003