Big Lots 2013 Annual Report Download - page 190
Download and view the complete annual report
Please find page 190 of the 2013 Big Lots annual report below. You can navigate through the pages in the report by either clicking on the pages listed below, or by using the keyword search tool below to find specific information within the annual report.-
 1
1 -
2
-
3
-
4
-
5
-
6
-
7
-
8
-
9
-
10
-
11
-
12
-
13
-
14
-
15
-
16
-
17
-
18
-
19
-
20
-
21
-
22
-
23
-
24
-
25
-
26
-
27
-
28
-
29
-
30
-
31
-
32
-
33
-
34
-
35
-
36
-
37
-
38
-
39
-
40
-
41
-
42
-
43
-
44
-
45
-
46
-
47
-
48
-
49
-
50
-
51
-
52
-
53
-
54
-
55
-
56
-
57
-
58
-
59
-
60
-
61
-
62
-
63
-
64
-
65
-
66
-
67
-
68
-
69
-
70
-
71
-
72
-
73
-
74
-
75
-
76
-
77
-
78
-
79
-
80
-
81
-
82
-
83
-
84
-
85
-
86
-
87
-
88
-
89
-
90
-
91
-
92
-
93
-
94
-
95
-
96
-
97
-
98
-
99
-
100
-
101
-
102
-
103
-
104
-
105
-
106
-
107
-
108
-
109
-
110
-
111
-
112
-
113
-
114
-
115
-
116
-
117
-
118
-
119
-
120
-
121
-
122
-
123
-
124
-
125
-
126
-
127
-
128
-
129
-
130
-
131
-
132
-
133
-
134
-
135
-
136
-
137
-
138
-
139
-
140
-
141
-
142
-
143
-
144
-
145
-
146
-
147
-
148
-
149
-
150
-
151
-
152
-
153
-
154
-
155
-
156
-
157
-
158
-
159
-
160
-
161
-
162
-
163
-
164
-
165
-
166
-
167
-
168
-
169
-
170
-
171
-
172
-
173
-
174
-
175
-
176
-
177
-
178
-
179
-
 180
180 -
 181
181 -
 182
182 -
 183
183 -
 184
184 -
 185
185 -
 186
186 -
 187
187 -
 188
188 -
 189
189 -
 190
190 -
 191
191 -
 192
192 -
 193
193 -
 194
194 -
 195
195 -
 196
196 -
 197
197 -
 198
198 -
 199
199 -
 200
200 -
201
-
202
-
203
-
204
-
205
-
206
-
207
-
208
-
209
-
210
-
211
-
212
-
213
-
214
-
215
-
216
-
217
-
218
-
219
-
220
-
221
-
222
-
223
-
224
-
225
-
226
-
227
-
228
-
229
-
230
-
231
-
232
-
233
-
234
-
235
-
236
-
237
-
238
 |
 |
48
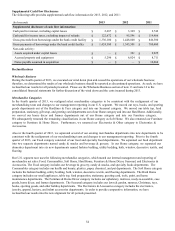
Investments
Investment securities are classified as available-for-sale, held-to-maturity, or trading at the date of purchase. Investments are
recorded at fair value as either current assets or non-current assets based on the stated maturity or our plans to either hold or sell
the investment. Unrealized holding gains and losses on trading securities are recognized in earnings. Unrealized holding gains
and losses on available-for-sale securities are recognized in other comprehensive income, until realized. We did not own any
held-to-maturity or available-for-sale securities as of February 1, 2014 and February 2, 2013.
Merchandise Inventories
Merchandise inventories are valued at the lower of cost or market using the average cost retail inventory method. Cost includes
any applicable inbound shipping and handling costs associated with the receipt of merchandise into our distribution centers
(See the discussion below under the caption “Selling and Administrative Expenses” for additional information regarding
outbound shipping and handling costs to our stores). Market is determined based on the estimated net realizable value, which
generally is the merchandise selling price. Under the average cost retail inventory method, inventory is segregated into classes
of merchandise having similar characteristics at its current retail selling value. Current retail selling values are converted to a
cost basis by applying an average cost factor to each specific merchandise class' retail selling value. Cost factors represent the
average cost-to-retail ratio computed using beginning inventory and all fiscal year-to-date purchase activity specific to each
merchandise class.
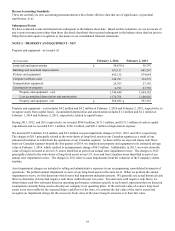
Under our previous inventory management system which was used through the end of 2011, we calculated average cost at the
department level which constituted 50 inventory cost pools. On January 29, 2012, the first day of 2012, we completed the
implementation of our new inventory management systems, which has allowed us to more precisely determine our inventory
cost under the average cost retail inventory method. We now calculate average cost at the class level which constitutes
approximately 350 inventory cost pools.
As the impact of the accounting change in the beginning of the 2012 inventory was immaterial, we recognized the cumulative
effect of the change in accounting principle as an expense in 2012 by recording a reduction in inventory and a corresponding
increase to cost of sales of approximately $5.6 million in the first quarter of 2012. This non-cash charge reduced the 2012
income from continuing operations and net income by approximately $3.4 million and reduced 2012 basic and diluted earnings
per share from continuing operations by $0.06.
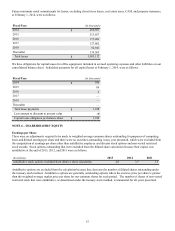
Under the average cost retail inventory method, permanent sales price markdowns result in cost reductions in inventory. Our
permanent sales price markdowns are typically related to end of season clearance events and are recorded as a charge to cost of
sales in the period of management's decision to initiate sales price reductions with the intent not to return the price to regular
retail. Promotional markdowns are recorded as a charge to net sales in the period the merchandise is sold. Promotional
markdowns are typically related to specific marketing efforts with respect to products maintained continuously in our stores or
products that are only available in limited quantities but represent substantial value to our customers. Promotional markdowns
are principally used to drive higher sales volume during a defined promotional period.
We record a reduction to inventories and charge to cost of sales for a shrinkage inventory allowance. The shrinkage allowance
is calculated as a percentage of sales for the period from the last physical inventory date to the end of the reporting period.
Such estimates are based on our historical and current year experience based on physical inventory results.
We record a reduction to inventories and charge to cost of sales for any excess or obsolete inventory. The excess or obsolete
inventory is estimated based on a review of our aged inventory and takes into account any items that have already received a
cost reduction as a result of the permanent markdown process discussed above. We estimate the reduction for excess or
obsolete inventory based on historical sales trends, age and quantity of product on hand, and anticipated future sales.
Payments Received from Vendors
Payments received from vendors relate primarily to rebates and reimbursement for markdowns and are recognized in our
consolidated statements of operations as a reduction to cost of inventory purchases in the period that the rebate or
reimbursement is earned or realized and, consequently, result in a reduction in cost of sales when the related inventory is sold.