ComEd 2003 Annual Report Download - page 118
Download and view the complete annual report
Please find page 118 of the 2003 ComEd annual report below. You can navigate through the pages in the report by either clicking on the pages listed below, or by using the keyword search tool below to find specific information within the annual report.-
 1
1 -
2
-
3
-
4
-
5
-
6
-
7
-
8
-
9
-
10
-
11
-
12
-
13
-
14
-
15
-
16
-
17
-
18
-
19
-
20
-
21
-
22
-
23
-
24
-
25
-
26
-
27
-
28
-
29
-
30
-
31
-
32
-
33
-
34
-
35
-
36
-
37
-
38
-
39
-
40
-
41
-
42
-
43
-
44
-
45
-
46
-
47
-
48
-
49
-
50
-
51
-
52
-
53
-
54
-
55
-
56
-
57
-
58
-
59
-
60
-
61
-
62
-
63
-
64
-
65
-
66
-
67
-
68
-
69
-
70
-
71
-
72
-
73
-
74
-
75
-
76
-
77
-
78
-
79
-
80
-
81
-
82
-
83
-
84
-
85
-
86
-
87
-
88
-
89
-
90
-
91
-
92
-
93
-
94
-
95
-
96
-
97
-
98
-
99
-
100
-
101
-
102
-
103
-
104
-
105
-
106
-
107
-
 108
108 -
 109
109 -
 110
110 -
 111
111 -
 112
112 -
 113
113 -
 114
114 -
 115
115 -
 116
116 -
 117
117 -
 118
118 -
 119
119 -
 120
120 -
 121
121 -
 122
122 -
 123
123 -
 124
124 -
 125
125 -
 126
126 -
 127
127 -
 128
128 -
129
-
130
-
131
-
132
-
133
-
134
-
135
-
136
-
137
-
138
 |
 |

116 Notes to Consolidated Financial Statements
EXELON CORPORATION AND SUBSIDIARY COMPANIES
Net realized losses of $16 million, $32 million and $127 million
were recognized in other income and deductions in Exelon’s
Consolidated Statements of Income for the years ended De-
cember 31, 2003, 2002 and 2001, respectively. Additionally,
net realized gains of $2 million and $14 million were recog-
nized in accumulated depreciation and regulatory assets in
Exelon’s Consolidated Balance Sheets at December 31, 2002,
and 2001, respectively. The fixed-income available-for-sale
securities held at December 31, 2003 have an average
maturity range of seven to nine years. The cost of these
securities was determined on the basis of specific identi-
fication. See Note 13—Nuclear Decommissioning and Spent
Fuel Storage for further information regarding the nuclear
decommissioning trusts.
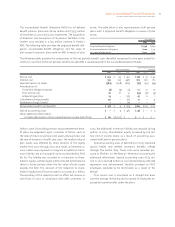
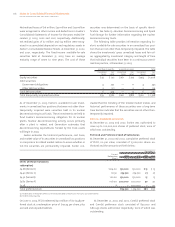
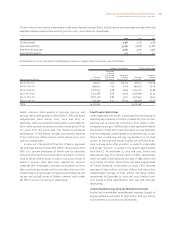
The following table provides information regarding Ex-
elon’s available-for-sale securities in an unrealized loss posi-
tion that are not other-than-temporarily impaired. The table
shows the investments’ gross unrealized losses and fair val-
ue, aggregated by investment category and length of time
that individual securities have been in a continuous unreal-
ized loss position, at December 31, 2003.
Less than 12 months 12 months or more Total
Unrealized
losses
Fair
value
Unrealized
losses
Fair
value
Unrealized
losses
Fair
value
Equity securities $33 $ 231 $261 $ 775 $294 $1,006
Debt securities
Government obligations 4 232 — 11 4 243
Other debt securities 2 117 — 2 2 119
Total debt securities 6 349 — 13 6 362
Total temporarily impaired securities $39 $580 $261 $788 $300 $ 1,368
As of December 31, 2003, Exelon’s available-for-sale invest-
ments in unrealized loss positions that were not other-than-
temporarily impaired were securities held in its nuclear
decommissioning trust funds. These investments are held to
fund Exelon’s decommissioning obligation for its nuclear
plants. Nuclear decommissioning activity occurs primarily
after a plant is retired, and Generation estimates that
decommissioning expenditures funded by the trust assets
will begin in 2029.
Exelon evaluates the historical performance, cost basis,
and market value of its securities in unrealized loss positions
in comparison to related market indices to assess whether or
not the securities are permanently impaired. Exelon con-
cluded that the trending of the related market indices and
historical performance of these securities over a long-term
time horizon indicates that the securities are not other-than-
temporarily impaired.
NOTE 16 ‰PREFERRED SECURITIES
At December 31, 2003 and 2002, Exelon was authorized to
issue up to 100,000,000 shares of preferred stock, none of
which was outstanding.
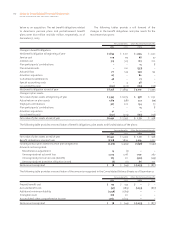
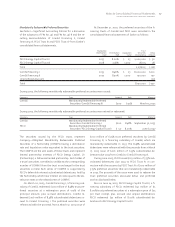
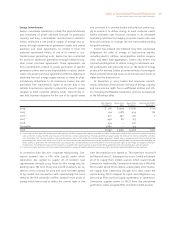
Preferred and Preference Stock of Subsidiaries
At December 31, 2003 and 2002, cumulative preferred stock
of PECO, no par value, consisted of 15,000,000 shares au-
thorized and the amounts set forth below:
December 31,
Current
Redemption
Price(a)
2003 2002 2003 2002
Shares Outstanding Dollar Amount
Series (without mandatory
redemption)
$4.68 (Series D) $104.00 150,000 150,000 $15 $15
$4.40 (Series C) 112.50 274,720 274,720 27 27
$4.30 (Series B) 102.00 150,000 150,000 15 15
$3.80 (Series A) 106.00 300,000 300,000 30 30
$7.48 (b) –500,000 –50
Total preferred stock 874,720 1,374,720 $87 $137
(a) Redeemable, at the option of PECO, at the indicated dollar amounts per share, plus accrued dividends.
(b) Redeemed during 2003.
On June 11, 2003, PECO redeemed $50 million of its $7.48 pre-
ferred stock at a redemption price of $103.74 per share, plus
accrued and unpaid dividends.
At December 31, 2003 and 2002, ComEd preferred stock
and ComEd preference stock consisted of 850,000 and
6,810,451 shares authorized, respectively, none of which was
outstanding.