ComEd 2003 Annual Report Download - page 43
Download and view the complete annual report
Please find page 43 of the 2003 ComEd annual report below. You can navigate through the pages in the report by either clicking on the pages listed below, or by using the keyword search tool below to find specific information within the annual report.-
 1
1 -
2
-
3
-
4
-
5
-
6
-
7
-
8
-
9
-
10
-
11
-
12
-
13
-
14
-
15
-
16
-
17
-
18
-
19
-
20
-
21
-
22
-
23
-
24
-
25
-
26
-
27
-
28
-
29
-
30
-
31
-
32
-
 33
33 -
 34
34 -
 35
35 -
 36
36 -
 37
37 -
 38
38 -
 39
39 -
 40
40 -
 41
41 -
 42
42 -
 43
43 -
 44
44 -
 45
45 -
 46
46 -
 47
47 -
 48
48 -
 49
49 -
 50
50 -
 51
51 -
 52
52 -
 53
53 -
54
-
55
-
56
-
57
-
58
-
59
-
60
-
61
-
62
-
63
-
64
-
65
-
66
-
67
-
68
-
69
-
70
-
71
-
72
-
73
-
74
-
75
-
76
-
77
-
78
-
79
-
80
-
81
-
82
-
83
-
84
-
85
-
86
-
87
-
88
-
89
-
90
-
91
-
92
-
93
-
94
-
95
-
96
-
97
-
98
-
99
-
100
-
101
-
102
-
103
-
104
-
105
-
106
-
107
-
108
-
109
-
110
-
111
-
112
-
113
-
114
-
115
-
116
-
117
-
118
-
119
-
120
-
121
-
122
-
123
-
124
-
125
-
126
-
127
-
128
-
129
-
130
-
131
-
132
-
133
-
134
-
135
-
136
-
137
-
138
 |
 |

41Management’s Discussion and Analysis of Financial Condition and Results of Operations
EXELON CORPORATION AND SUBSIDIARY COMPANIES
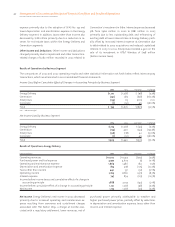
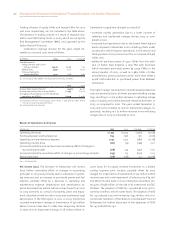
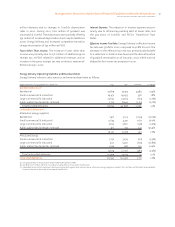
Operating Revenues. The changes in Energy Delivery’s
operating revenues for 2003 compared to 2002 consisted of
the following:
Energy Delivery Electric Gas
Total
Variance
Customer choice $ (167) $ – $(167)
Weather (229) 71 (158)
Resales and other – (22) (22)
Rate changes and mix (58) 51 (7)
Volume 118 (3) 115
Other effects (15) (1) (16)
(Decrease) increase in
operating revenues $ (351) $96 $(255)
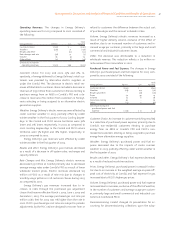
Customer Choice. For 2003 and 2002, 25% and 21%, re-
spectively, of energy delivered to Energy Delivery’s retail cus-
tomers was provided by alternative electric suppliers or
under the ComEd PPO. The decrease in electric retail rev-
enues attributable to customer choice included a decrease in
revenues of $155 million from customers in Illinois electing to
purchase energy from an ARES or ComEd’s PPO and a de-
crease in revenues of $12 million from customers in Pennsyl-
vania selecting or being assigned to an alternative electric
generation supplier.
Weather. Energy Delivery’s electric revenues were affected by
cooler summer weather in 2003, partially offset by colder
winter weather in the first quarter of 2003. Cooling degree-
days in the ComEd and PECO service territories were 36%
lower and 21% lower, respectively, in 2003 as compared to
2002. Heating degree-days in the ComEd and PECO service
territories were 5% higher and 16% higher, respectively, in
2003 as compared to 2002.
Energy Delivery’s gas revenues were affected by colder
winter weather in the first quarter of 2003.
Resales and other. Energy Delivery’s gas revenues decreased
as a result of a decrease in off-system sales, exchanges and
capacity releases.
Rate Changes and Mix. Energy Delivery’s electric revenues
decreased $33 million at ComEd primarily due to decreased
average energy rates under ComEd’s PPO as a result of lower
wholesale market prices. Electric revenues decreased $25
million at PECO as a result of rate mix due to changes in
monthly usage patterns in all customer classes during 2003
as compared to 2002.
Energy Delivery’s gas revenues increased due to in-
creases in rates through the purchased gas adjustment
clause that became effective March 1, 2003, June 1, 2003 and
December 1, 2003. The average purchased gas cost rate per
million cubic feet for 2003 was 11% higher than the rate in
2002. PECO’s purchased gas cost rates are subject to periodic
adjustments by the PUC and are designed to recover from or
refund to customers the difference between the actual cost
of purchased gas and the amount included in rates.
Volume. Energy Delivery’s electric revenues increased as a
result of higher delivery volume, exclusive of the effect of
weather, due to an increased number of customers and in-
creased usage per customer, primarily in the large and small
commercial and industrial customer classes.
Other. The decrease was attributable to a reduction in
wholesale revenue. This reduction reflects a $12 million re-
imbursement from Generation in 2002.
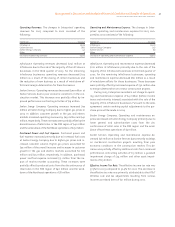
Purchased Power and Fuel Expense. The changes in Energy
Delivery’s purchased power and fuel expense for 2003 com-
pared to 2002 consisted of the following:
Energy Delivery Electric Gas
Total
Variance
Customer choice $(143) $ – $(143)
Weather (119) 49 (70)
Resales and other – (28) (28)
Prices 74 39 113
Volume 73 6 79
Decommissioning 62 – 62
Other (23) 5 (18)
(Decrease) increase in
purchased power and fuel
expense $ (76) $ 71 $ (5)
Customer Choice. An increase in customer switching resulted
in a reduction of purchased power expense, primarily due to
ComEd’s non-residential customers electing to purchase
energy from an ARES or ComEd’s PPO and PECO’s non-
residential customers electing or being assigned to purchase
energy from alternative energy suppliers.
Weather. Energy Delivery’s purchased power and fuel ex-
pense decreased due to the impacts of cooler summer
weather in 2003, partially offset by colder winter weather in
the first quarter of 2003.
Resales and other. Energy Delivery’s fuel expense decreased
as a result of reduced resale transactions.
Prices. Energy Delivery’s purchased power increased for elec-
tric due to an increase in the weighted average on-peak/off-
peak cost of electricity at ComEd, and fuel expense for gas
increased due to PECO’s higher gas prices.
Volume. Energy Delivery’s purchased power and fuel expense
increased due to increases, exclusive of the effect of weather,
in the number of customers and average usage per custom-
er, primarily large and small commercial and industrial cus-
tomers at ComEd and PECO.
Decommissioning. ComEd changed its presentation for ac-
counting for decommissioning collections upon the adop-