Dell 2010 Annual Report Download - page 32
Download and view the complete annual report
Please find page 32 of the 2010 Dell annual report below. You can navigate through the pages in the report by either clicking on the pages listed below, or by using the keyword search tool below to find specific information within the annual report.-
 1
1 -
2
-
3
-
4
-
5
-
6
-
7
-
8
-
9
-
10
-
11
-
12
-
13
-
14
-
15
-
16
-
17
-
18
-
19
-
20
-
21
-
 22
22 -
 23
23 -
 24
24 -
 25
25 -
 26
26 -
 27
27 -
 28
28 -
 29
29 -
 30
30 -
 31
31 -
 32
32 -
 33
33 -
 34
34 -
 35
35 -
 36
36 -
 37
37 -
 38
38 -
 39
39 -
 40
40 -
 41
41 -
 42
42 -
43
-
44
-
45
-
46
-
47
-
48
-
49
-
50
-
51
-
52
-
53
-
54
-
55
-
56
-
57
-
58
-
59
-
60
-
61
-
62
-
63
-
64
-
65
-
66
-
67
-
68
-
69
-
70
-
71
-
72
-
73
-
74
-
75
-
76
-
77
-
78
-
79
-
80
-
81
-
82
-
83
-
84
-
85
-
86
-
87
-
88
-
89
-
90
-
91
-
92
-
93
-
94
-
95
-
96
-
97
-
98
-
99
-
100
-
101
-
102
-
103
-
104
-
105
-
106
-
107
-
108
-
109
-
110
-
111
-
112
-
113
-
114
-
115
-
116
-
117
-
118
-
119
-
120
-
121
-
122
-
123
-
124
-
125
-
126
-
127
-
128
-
129
-
130
-
131
-
132
-
133
-
134
-
135
-
136
-
137
-
138
-
139
-
140
-
141
-
142
-
143
-
144
-
145
-
146
-
147
-
148
-
149
-
150
-
151
-
152
-
153
-
154
 |
 |

Table of Contents
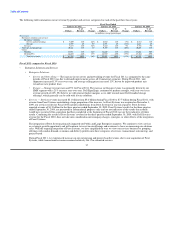
• Research, Development, and Engineering — During Fiscal 2011, research, development, and engineering ("RD&E") expenses
remained at approximately 1% of revenue, consistent with the prior fiscal year. We manage our research, development, and
engineering spending by targeting those innovations and products that we believe are most valuable to our customers and by relying
upon the capabilities of our strategic relationships. We will continue to invest in RD&E activities to support our growth and to
provide for new, competitive products.
Total operating expenses for Fiscal 2011 increased 12% to $8.0 billion on a GAAP basis and 14% to $7.6 billion on a non-GAAP basis
for Fiscal 2011 over Fiscal 2010. Operating expenses on a GAAP basis for Fiscal 2011 and Fiscal 2010 includes severance and facility
charges, amortization of intangible assets, and acquisition-related charges. For Fiscal 2011, operating expenses on a GAAP basis also
includes $100 million we incurred for our settlement of the SEC investigation and a $40 million charge for a securities litigation class
action lawsuit that was filed against Dell during Fiscal 2007. See "Part II — Item 9A — Controls and Procedures" for further discussion
of our settlement of the SEC investigation. As set forth in the reconciliation under "Non-GAAP Financial Measures" below, non-GAAP
operating expenses for Fiscal 2011 and for Fiscal 2010 excludes the effects of these severance and facility action costs, amortization of
intangible assets, and acquisition-related charges, and, for Fiscal 2011, the settlements referred to above. Severance and facility action
costs included in operating expenses decreased year-over-year by 69% to $76 million for Fiscal 2011. Amortization of intangibles and
acquisition-related charges included in operating expenses increased 31% to $71 million and decreased 18% to $94 million over Fiscal
2010, respectively, and were primarily related to our acquisition of Perot Systems in Fiscal 2010 as well as our Fiscal 2011 acquisitions.
We expect integration costs related to our acquisitions, primarily of Perot Systems, to continue over the next fiscal years. In addition, we
will continue to review our costs across all processes and organizations with the goals of reducing complexity and eliminating
redundancies. While we have made significant progress in the transformation of our manufacturing and logistics areas, we expect to take
further actions to reduce costs while investing in strategic growth areas.
Fiscal 2010 compared to Fiscal 2009
• Selling, General, and Administrative — For Fiscal 2010, SG&A expenses decreased compared to Fiscal 2009 primarily due to
decreases in compensation, advertising expenses, and improved general spending controls. Compensation and benefits expense,
excluding expenses related to headcount reductions, decreased approximately $300 million in Fiscal 2010 compared to Fiscal 2009.
With the increase in retail volumes, which typically incur less advertising costs, advertising expenses decreased approximately
$200 million year-over-year from Fiscal 2009. Due to company-wide spending control measures, there were large decreases in most
other categories of expenses, including travel, maintenance, telecommunications, utilities, training, and recruiting, resulting in
savings of over $340 million. These decreases were partially offset by an increase in accounts receivable bad debt of $40 million
resulting from the challenging business environment during Fiscal 2010.
• Research, Development, and Engineering — For Fiscal 2010, RD&E expenses remained at approximately 1% of revenue, consistent
with prior years.
Total operating expenses for Fiscal 2010 decreased 9% to $7.1 billion on a GAAP basis and 11% to $6.7 billion on a non-GAAP basis
from Fiscal 2009. Operating expenses on a GAAP basis for Fiscal 2010 includes the effects of severance and facility action costs,
acquisition-related charges, and amortization of intangible assets. For Fiscal 2009, operating expenses on a GAAP basis includes the
effects of severance and facility action costs, amortization of intangible assets, and stock option accelerated vesting charges. As set forth
in the reconciliation under "Non-GAAP Financial Measures" below, these charges are excluded from operating expenses on a non-GAAP
basis. Severance and facility action costs included in operating expenses increased 80% to $245 million in Fiscal 2010. Acquisition-
related charges and amortization of intangibles included in operating expenses increased from $0 to $115 million for Fiscal 2010 and
17% to $54 million for Fiscal 2010. Operating expenses for amortization of intangible assets and acquisition-related costs were primarily
related to our acquisition of Perot Systems in Fiscal 2010. Non-GAAP operating expenses for Fiscal 2009 excluded $88 million in stock
option accelerated vesting charges.
28